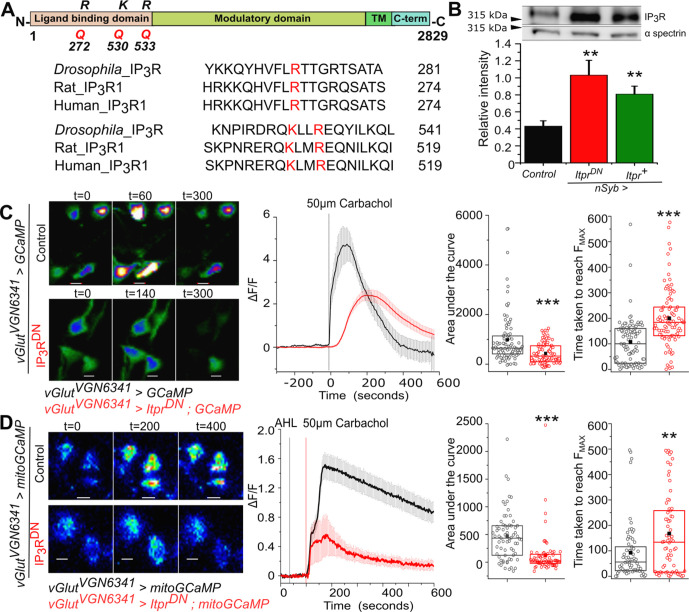
Figure 1. Generation and characterisation of a dominant negative IP3R (IP3RDN).
(A) Domain organisation of the Drosophila IP3R. The Arginine (R) and Lysine (K) residues mutated to Glutamine (Q) to generate a dominant-negative IP3R (IP3RDN) are shown (top). Alignment of the Drosophila IP3R with Rat IP3R1 and Human IP3R1 in the region of the mutated amino acids. All three residues (red) are conserved (below). (B) Significantly higher immuno-reactivity against the IP3R is observed upon pan-neuronal (nsybGAL4) expression of IP3RDN (UASitprDN) and IP3R (UASitpr+) in adult heads. Statistical comparison was made with respect to Canton S as control, n=5, **p< 0.05, t-test. (C) Representative images show changes in cytosolic Ca2+ in larval neurons of the indicated genotypes as judged by GCaMP6m fluorescence at the indicated time intervals after stimulation with Carbachol (Scale bars indicate 5 μm). Warmer colors denote increase in [Ca2+]cyt. Mean traces of normalized GCaMP6m fluorescence in response to Carbachol (4s/frame) in vGlutVGN6341GAL4 marked neurons, with (red) and without (black) IP3RDN (ΔF/F ± SEM) (middle panel). Area under the curve (right) was quantified from 0 - 420s from the traces in the middle. Time taken to reach peak fluorescence (FMAX) for individual cells (far right). vGlutVGN6341GAL4 > UAS GCaMP N = 6 brains, 92 cells; vGlutVGN6341GAL4 > UAS ItprDN; UAS GCaMP N = 6 brains, 95 cells. ***p< 0.005 (Two tailed Mann-Whitney U test). (D) Representative images show changes in mitochondrial Ca2+ in larval neurons of the indicated genotypes as judged by mitoGCaMP6m fluorescence at the indicated time intervals after stimulation with Carbachol (Scale bars indicate 5 μm). Warmer colors denote increase in [Ca2+]cyt. Mean traces of normalized mitoGCaMP6m fluorescence in response to Carbachol (2s/frame) in vGlutVGN6341GAL4 marked neurons, with (red) and without (black) IP3RDN (ΔF/F ± SEM) (middle panel). Area under the curve (right) was quantified from 100 to 400s from the traces in the middle. Time taken to reach peak fluorescence (FMAX) for individual cells (far right). vGlutVGN6341GAL4 > UAS mitoGCaMP N = 5 brains, 69 cells; vGlutVGN6341GAL4 > UAS ItprDN; UAS mitoGCaMP N = 5 brains, 68 cells. ***p< 0.005, **p< 0.05 (Two tailed Mann-Whitney U test).

