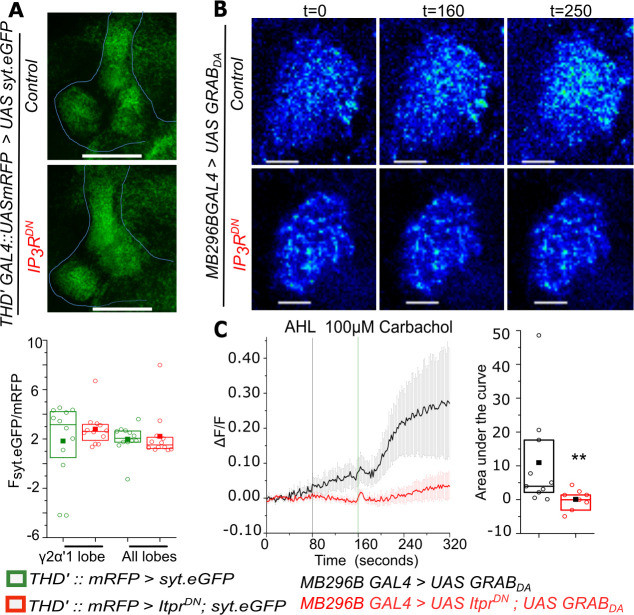
Figure 5. Carbachol-stimulated Dopamine release at the axonal terminals of PPL1-γ2α′1 neurons is attenuated by expression of IP3RDN.
(A) Representative images of a presynaptic marker synaptotagmin GFP (syt.eGFP) in lobes of the Mushroom body (top). Quantification of syt.eGFP fluorescence normalized to mRFP is shown below in the indicated MB regions marked by THD’GAL4. N = 6 brains, n.s. not significant at p < 0.05 by two tailed Mann-Whitney U test. Scale bars indicate 50 μm (B) Carbachol stimulated dopamine release at PPL1- γ2α′1 termini visualized by changes in GRABDA fluorescence in a representative mushroom body lobe from brains of the indicated genotypes. Images were acquired at 2s per frame. Brighter fluorescence denotes increase in Dopamine. Scale bars = 10 μm (C) Average traces (± SEM) of normalized GRABDA fluorescence responses (ΔF/F) from the right lobe of each brain upon addition of Carbachol (Green line) (panel on the left). Images were acquired at 2s per frame; Quantification of area under the curve was from the point of stimulation at 160s and up to 250 s. Box plots and symbols are as described in Figure 2A. MB296B GAL4 > UAS GRABDA N = 10 cells from 10 brains; MB296B GAL4 > UAS ItprDN; UAS GRABDA N = 8 cells from 8 brains. **p< 0.05, Mann-Whitney U test.


