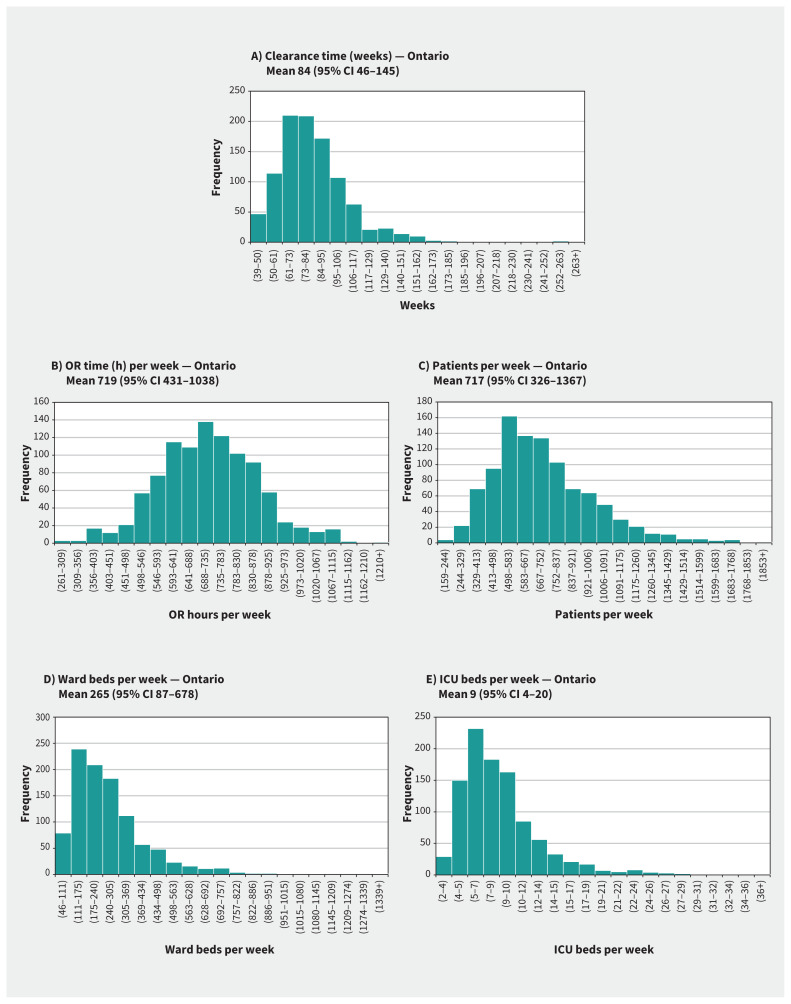
Figure 5:
Provincial results from the probabilistic sensitivity analysis for (A) clearance time, (B) operating room (OR) time per week, (C) patients per week, (D) ward beds per week and (E) intensive care unit (ICU) beds per week. The analyses were run 1000 times, and the frequencies add up to 1000. Note: CI = confidence interval.

