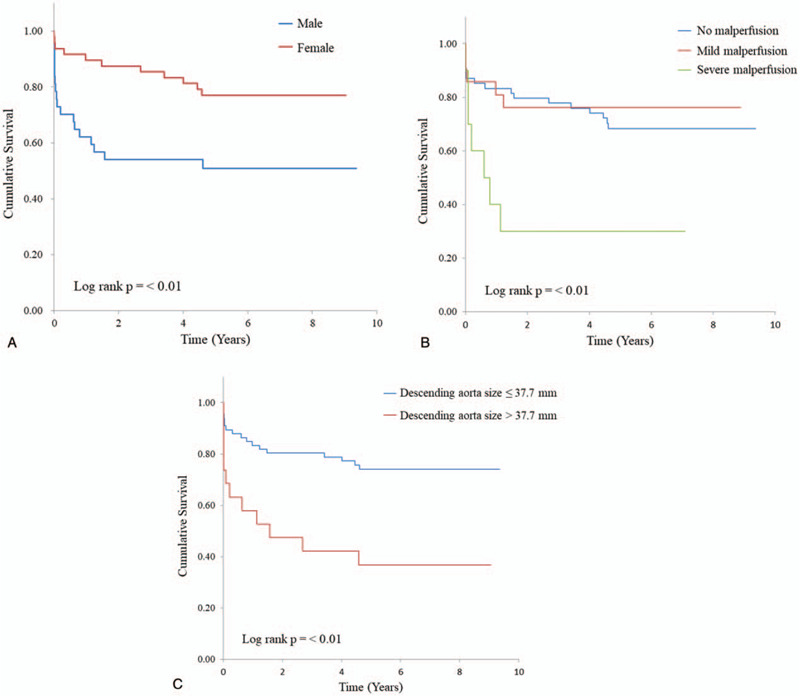
Figure 3.

Kaplan–Meier survival curves for sex, kidney malperfusion, and descending aorta size. Patients categorized by sex (A), kidney malperfusion (B), descending aorta size (37.7 mm) (C) differed significantly in survival probability (log rank P = <.01).
