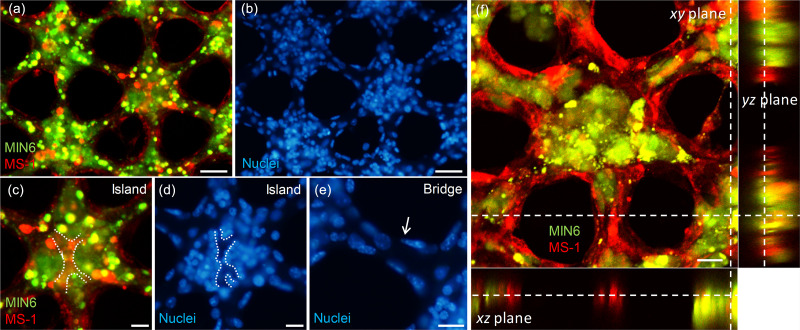
FIG. 4.
Fluorescence microscopic images of co-cultured beta cell clusters within collagen sheets. (a) A sheet with MIN6 cells stained in green and MS1 cells stained in red on day 7. (b) The same sheet containing both cells with the nuclei stained in blue. (c) and (d) Expanded images of (a) and (b) at the island area. The white dotted lines indicate the edge of the MS1 cells within the cluster. (e) Expanded image of (b) at the bridge area. The white arrow indicates MS1 cells present in the edge of the bridge pattern, not in the interior of that. (f) Sectioned images of co-cultured beta cell clusters on day 4 in the xy (center), xz (bottom), and yz (right) plane obtained from confocal imaging. The white dashed lines indicate the same position of the collagen sheet. Scale bars were 50 μm (a) and (b), 20 μm (c)–(e), and 25 μm (f).

