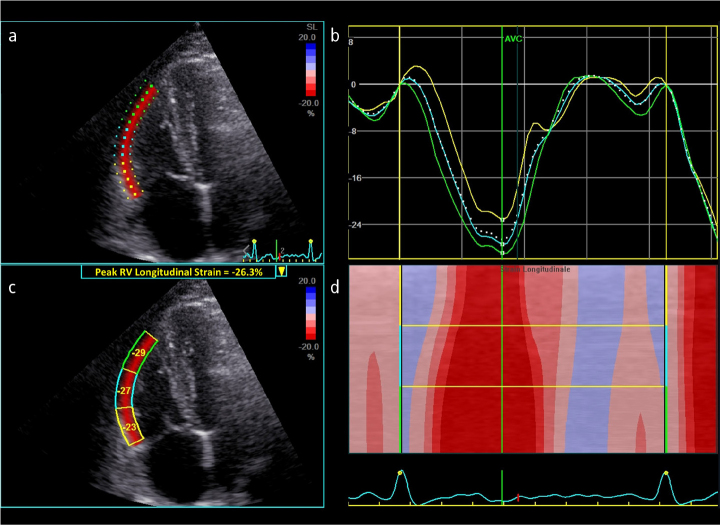
Figure 3. a–d.
(a) Speckle-tracking echocardiography for longitudinal strain analysis of the right ventricle (RV) free-wall from an RV-focused apical four-chamber view in a healthy subject. (b) The different colors of the curves represent different myocardial segments, while the white dotted curve represents the peak RV longitudinal strain of the free-wall during the cardiac cycle. (c) Regional and global peak RV free-wall longitudinal strain. (d) Anatomical M-mode color-coded display of segmental strain variations during the cardiac cycle.

