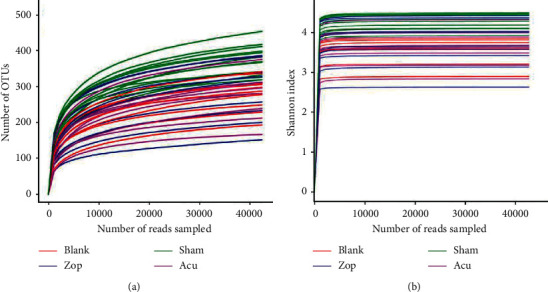
Figure 4.

Curves tended to approach the saturation plateau. (a) Rarefaction curves for OTUs and (b) Shannon index of the OTU number at 97% similarity. Red, green, blue, and purple colors represent blank, sham, Zop, and Acu groups, respectively. Tags were normalized to the minimum numbers of tags in all samples.
