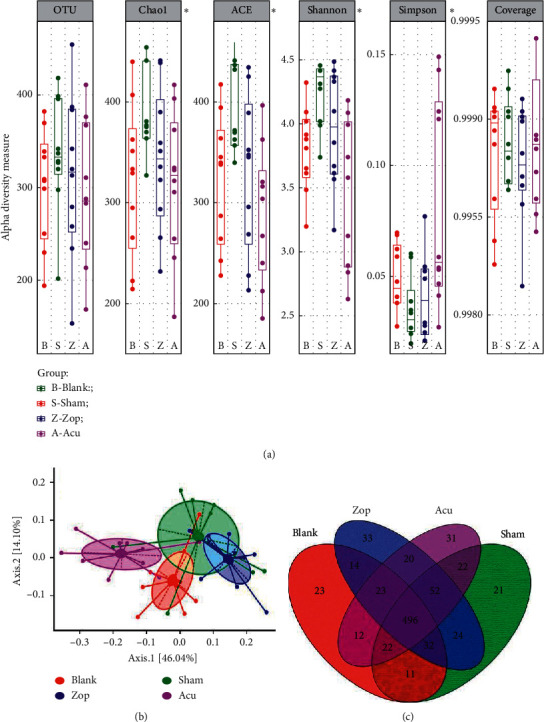
Figure 5.

Diversity indices of gut microbiota. (a) Estimated OTU richness and diversity indices (Chao1, ACE, Shannon, and Simpson) of the mice gut microbiome from four groups. An asterisk indicates index with significant differences (P < 0.05, one-way ANOVA). (b) Principal coordinate analysis (PCoA) of gut microbiota from four groups. Axis 1 explains the greatest proportion of compositional variation followed by Axis 2. (c) Venn plot showing the shared and unique OTUs found in each plotted group. Only taxa that are shared by all of the animals (core) within each group are plotted. Red, green, blue, and purple colors represent blank, sham, Zop, and Acu group, respectively.
