
Figure 1.
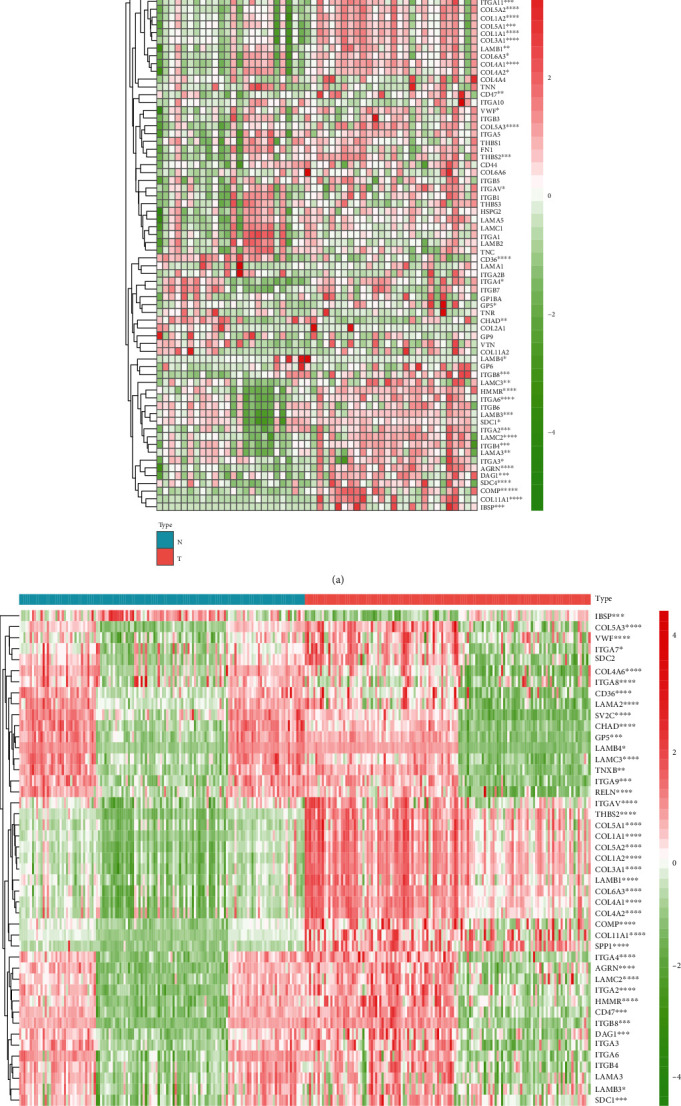
Differential expression of ECM-receptor interaction-related genes between tumor and matched normal tissues in TCGA and validation cohorts of gastric cancer. (a) The heat map showed differential expression of all ECM-receptor interaction-related genes of 26 pairs of tumorous and matched normal tissues of gastric cancer in TCGA. (b) The heat map validated 45 ECM-receptor interaction-related genes that were identified in the validation cohort (GSE29272) with 134 pairs of tumorous and matched normal tissues. TCGA: The Cancer Genome Atlas; N: adjacent tissue to cancer; T: tumorous tissue. ∗P < 0.05, ∗∗P < 0.01, ∗∗∗P < 0.001, and ∗∗∗∗P < 0.0001.