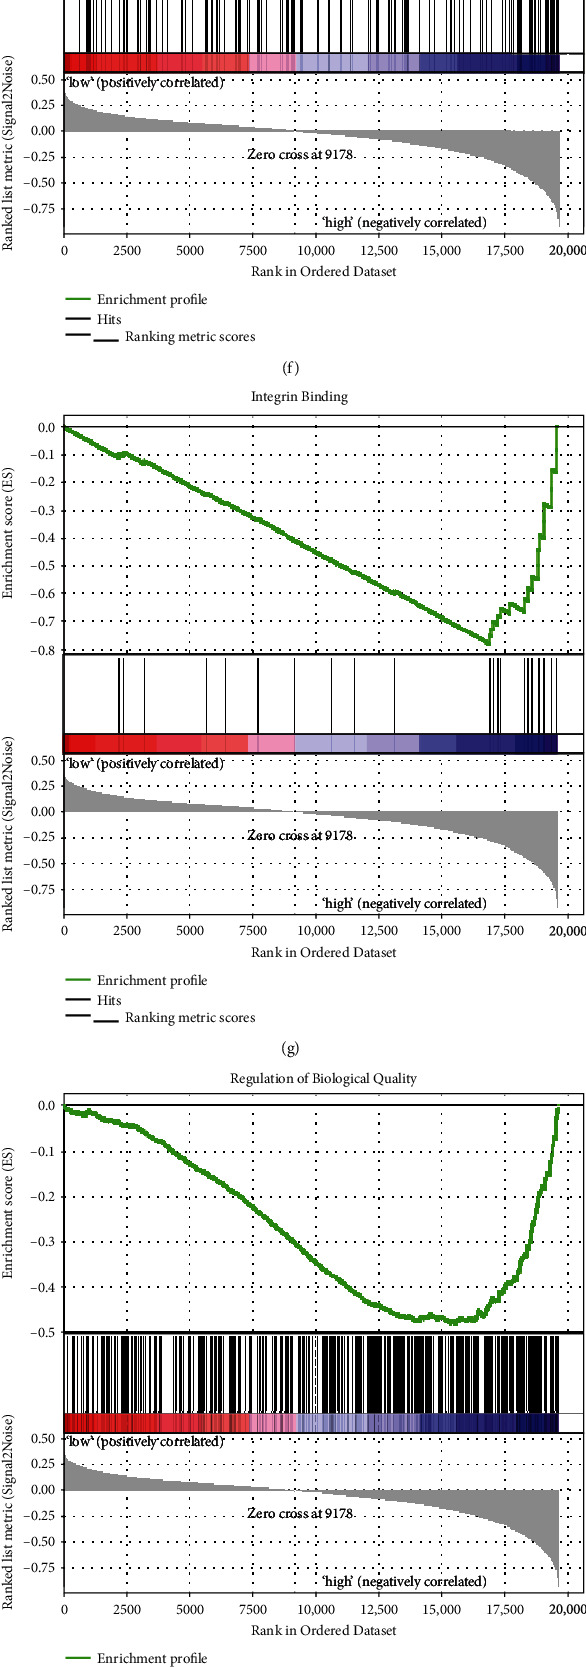
Figure 3.

Construction of the lasso regression model with ECM-receptor interaction-related genes and enrichment analyses. (a) The relation between partial likelihood deviances and number of genes involved in the risk model. (b) The solution paths of the risk model. (c) The coefficients of each gene involved in the risk model. (d–h) Top five enriched gene sets between high- and low-risk groups identified by the risk model. (i) The GO analysis between high- and low-risk groups identified by the risk model. (j) Top genes refer to the top BP. GO: BP: biological process; MF: molecular function; CC: cellular component; logFC: log2(fold change).
