
Figure 6.
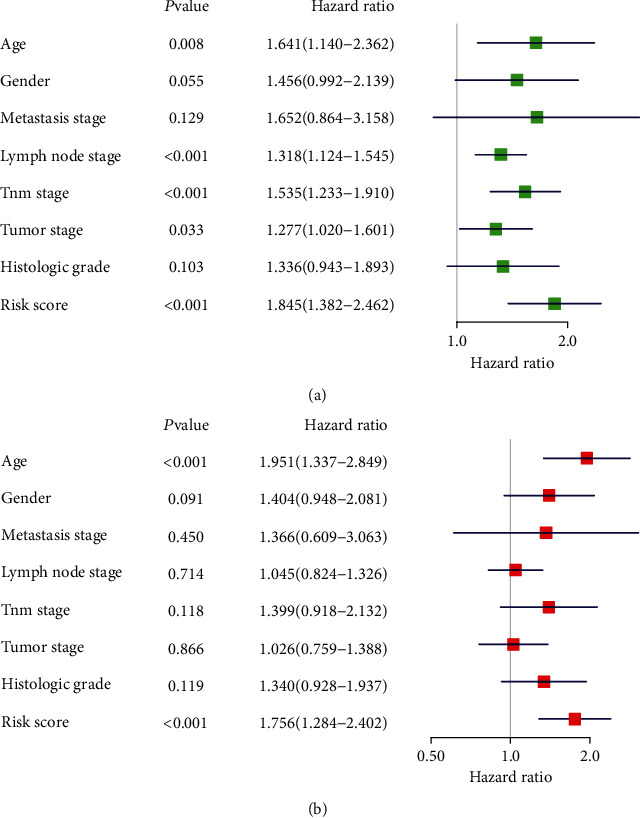
The forest plot of clinicopathologic features and the risk score. (a) Univariate analysis of clinicopathologic features and the risk score in TCGA cohort. (b) Multivariate analysis of clinicopathologic features and the risk score in TCGA cohort. Hazard ratios are shown with 95% confidence interval.