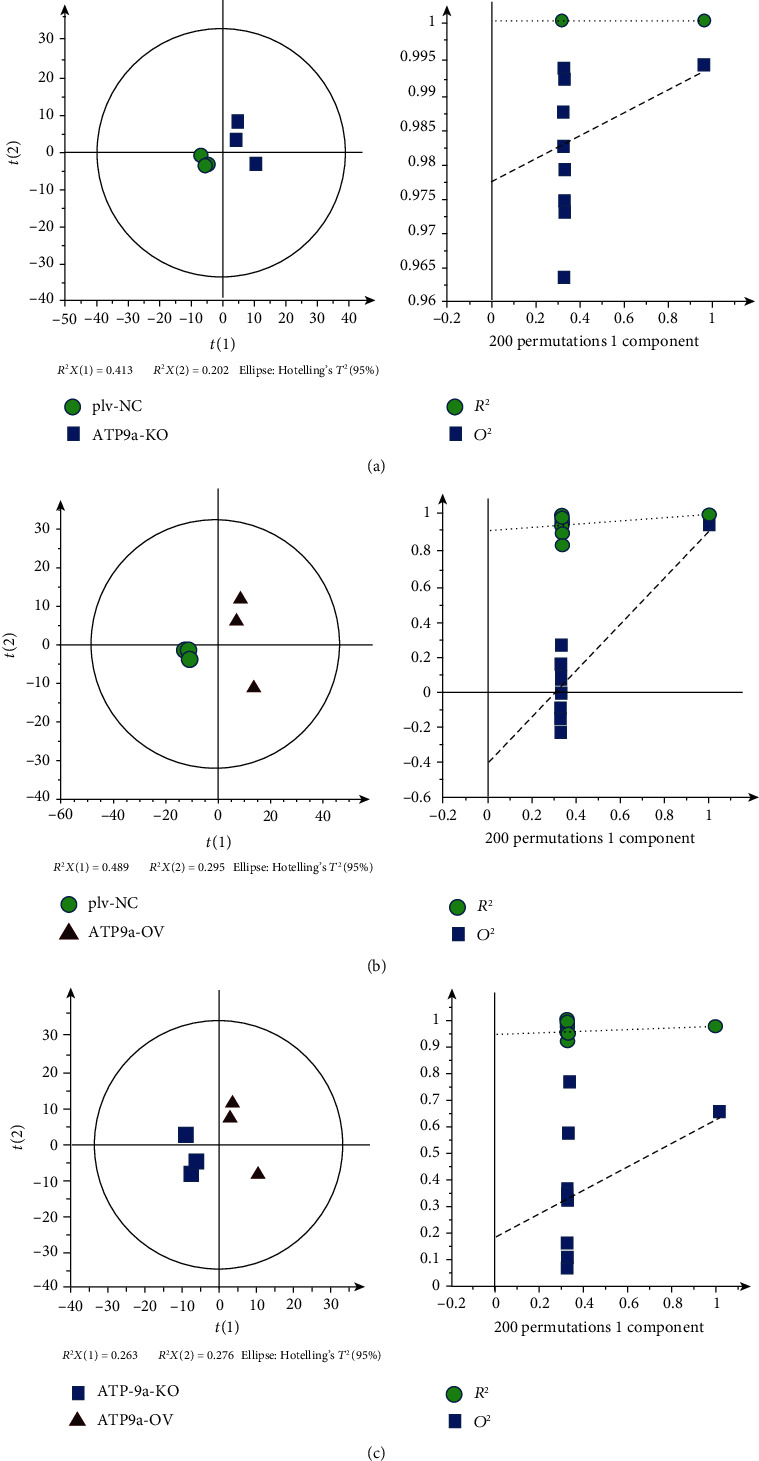
Figure 4.

The OPLS-DA score plots of the plv-NC, ATP9A-OV, and ATP9A-KO groups. (a) OPLS-DA score between the plv-NC and ATP9A-KO groups. (b) OPLS-DA score between the plv-NC and ATP9A-OV groups. (c) OPLS-DA score between the ATP9A-KO and ATP9A-OV groups.
