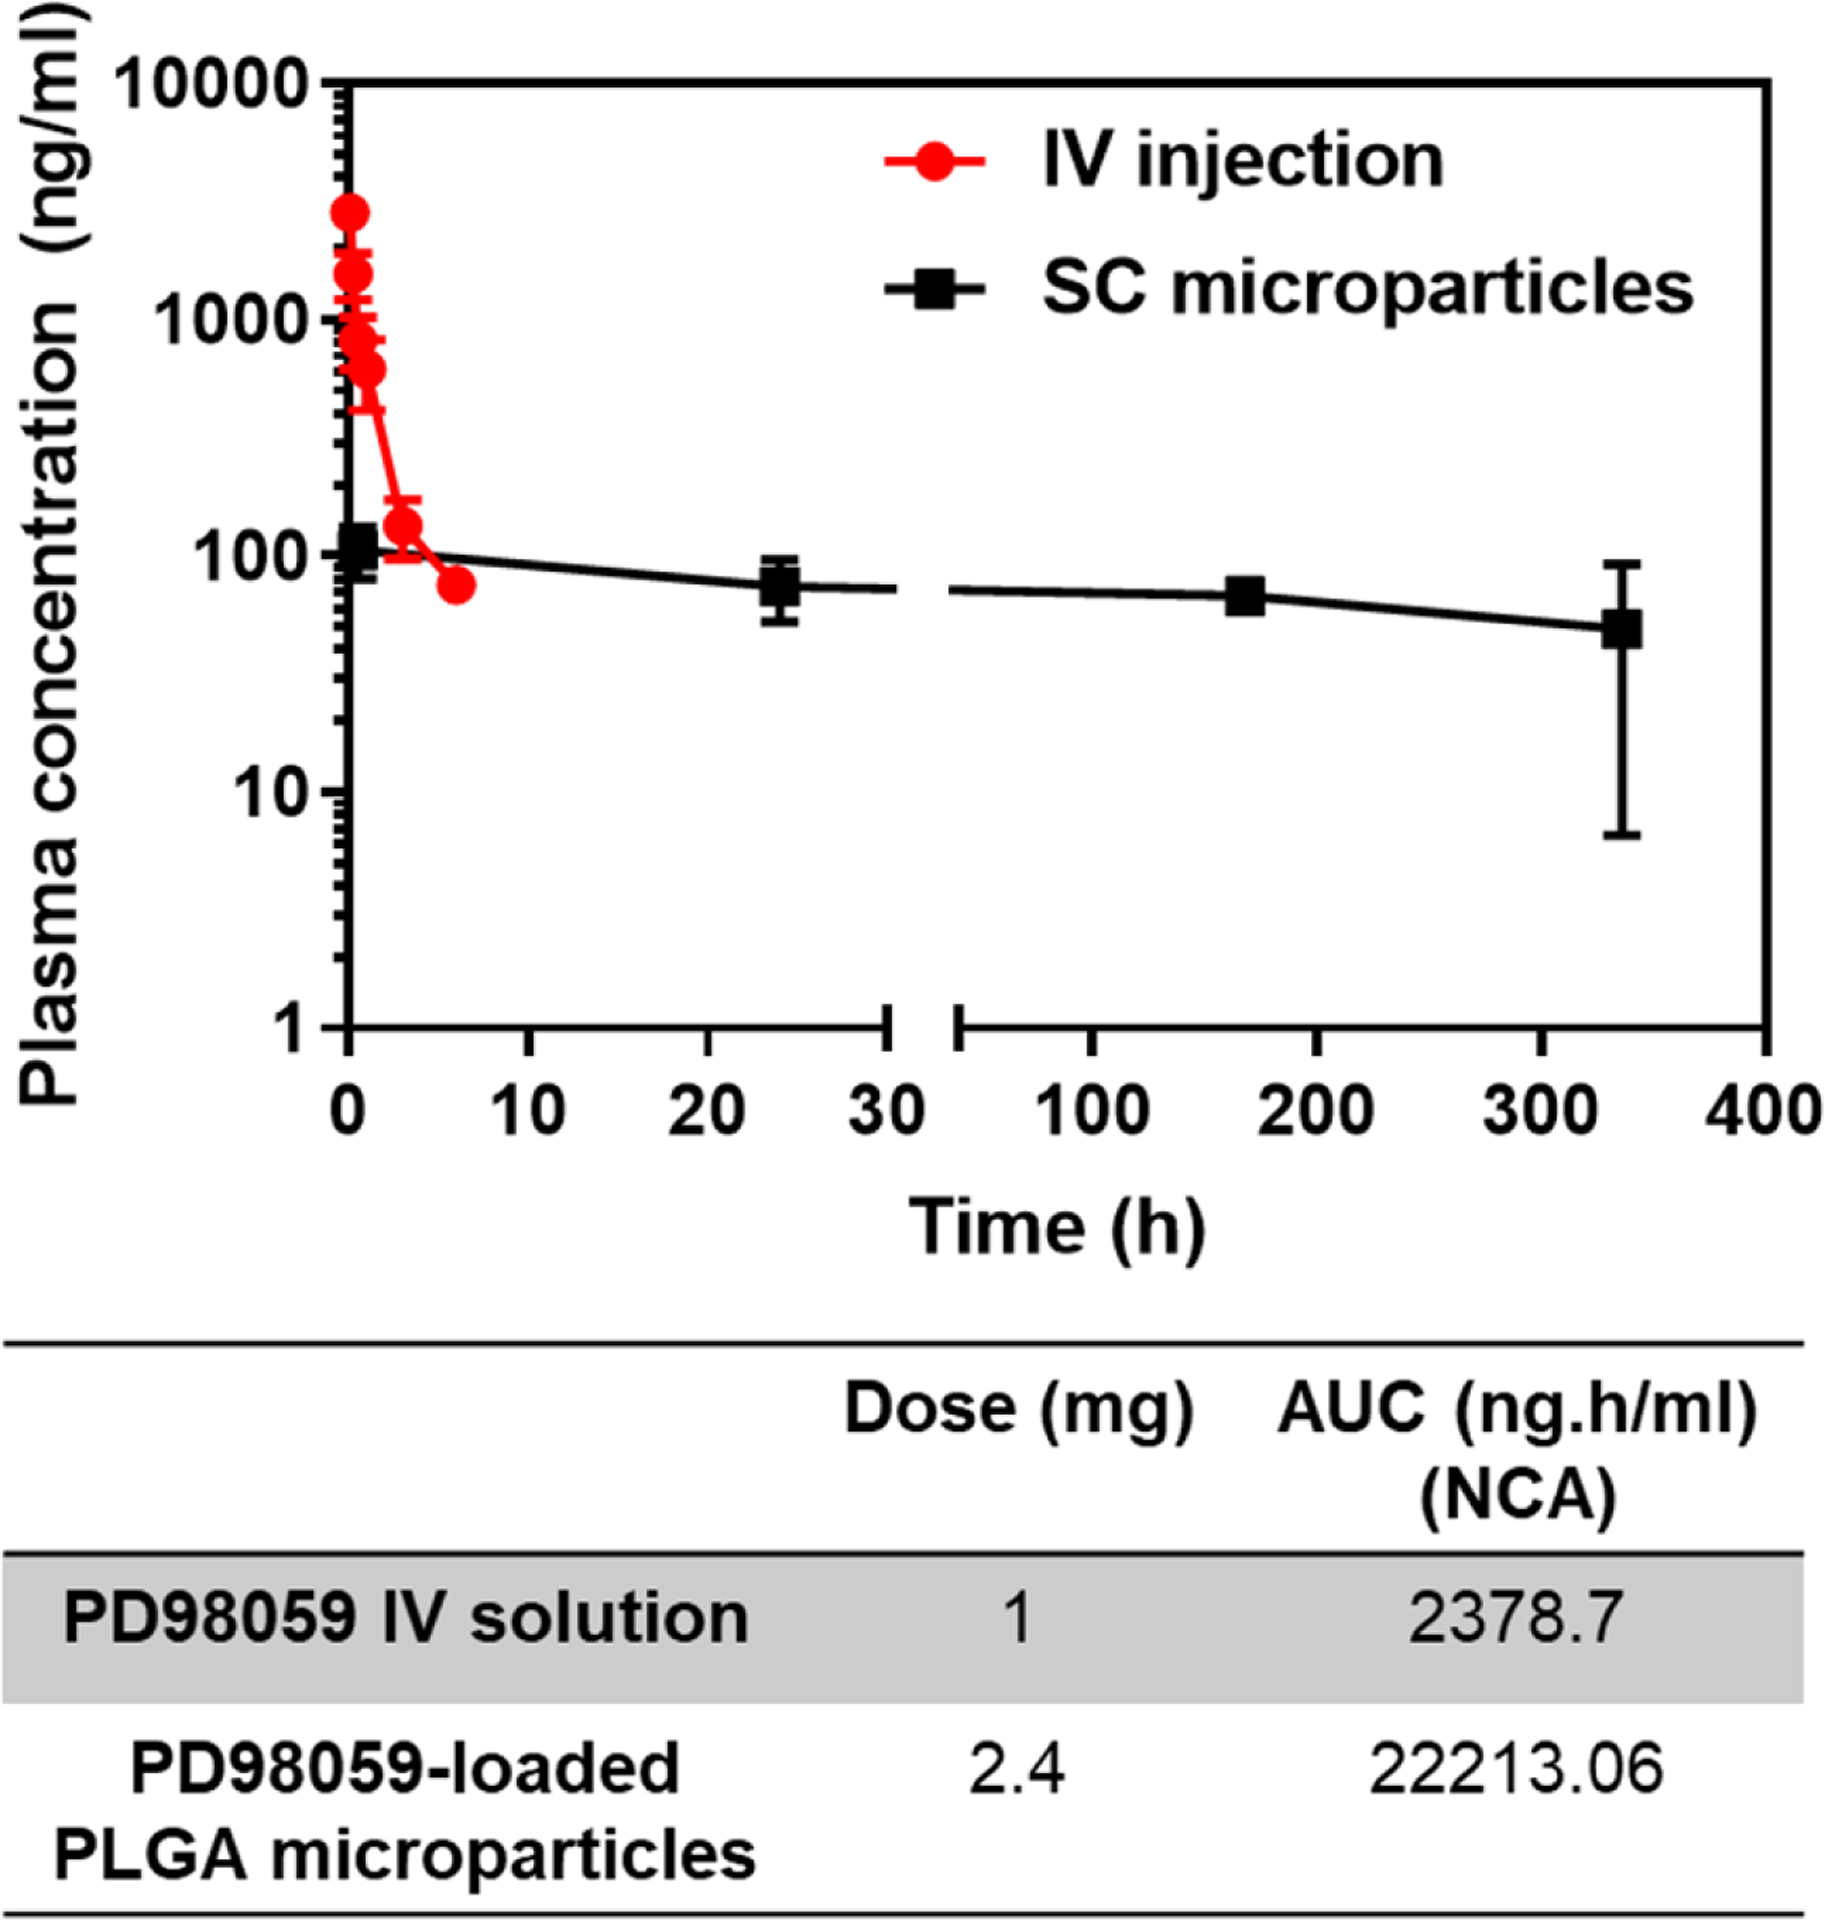
Figure 3:

Comparison of Plasma PD98059 levels vs. time curves following IV injection of PD98059 and SC injection of PD98059-loaded PLGA microparticles (data represent mean ± SD, n=3). AUC0-t calculations were based on non-compartmental analysis (NCA) using PK Solver ad-in.
