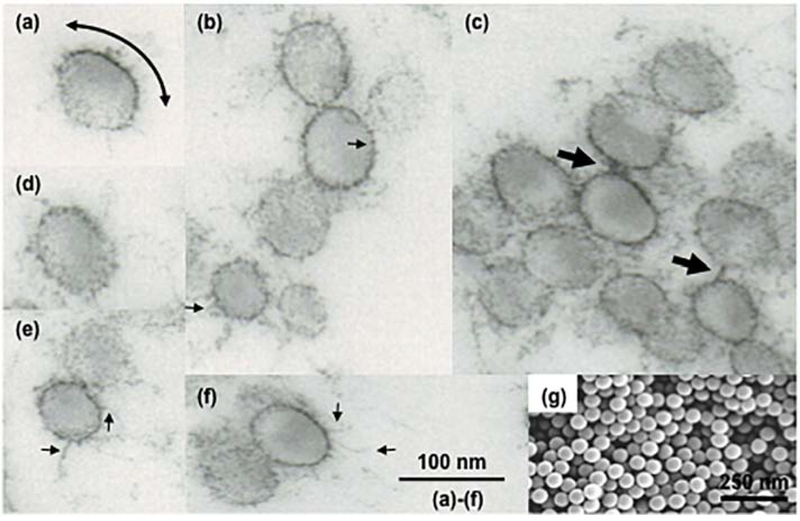
Figure 5.
Electron micrographs of model sulfated polystyrene nanospheres after dipping in fresh human plasma. (a–f) Transmission electron microscopy of polystyrene nanospheres (60 nm) dipped in neat human plasma for 2 min. The micrograph in (a) shows contrasting electron density on a nanosphere surface. This is a reflection of variable density of surface-bound proteins. The curved arrow depicts an electron dense region arising from excessive protein-protein interactions. Micrographs also show inhomogeneous and patchy protein deposition on many nanospheres as well as the presence of many electron dense spikes (small arrows). The spikes may represent nucleation sites arising from protein collapse into compact loops, strands, and turns leading to fibre formation. The arrows in (c) are example of protein deposits/fibers that have bridged adjacent nanospheres. (g) Scanning electron micrograph of untreated polystyrene nanospheres. Unpublished observations (S.M. Moghimi, Newcastle University).

