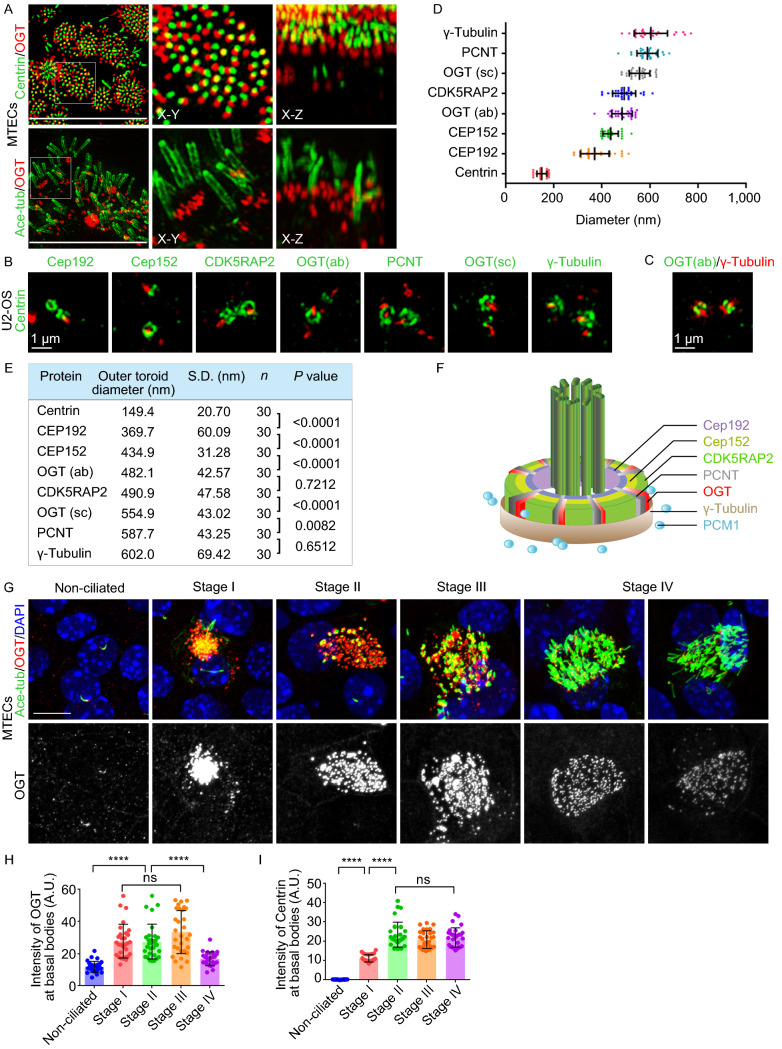
Figure 2.
OGT accumulates at the outer layer of the PCM and its localization changes during the ciliogenesis process. (A) MTECs fixed on ALI day 5 were subjected to immunofluorescence microscopy with antibodies against OGT and acetylated α-tubulin or centrin. (B) U2-OS cells were serum-starved and subjected to 3D-SIM with antibodies against OGT or different centrosome markers and centrin. (C) U2-OS cells were subjected to 3D-SIM with antibodies against OGT and γ-tubulin. (D) Quantification of the outer toroid diameters (nm) of the indicated centrosome proteins. (E) Summary of the toroid quantifications measured in D. n represents the number of centrosomes measured. Mann-Whitney test was performed for statistical analysis. (F) Model for the organization of the centrosome proteins. (G–I) MTECs were subjected to immunofluorescence microscopy for OGT and acetylated α-tubulin and grouped at different stages (G). The intensity of OGT and centrin at the basal bodies grouped to the indicated stages was then quantified by Mann-Whitney test (H and I). Scale bars, 10 μm unless specified. ****P < 0.0001; ns, not significant. Error bars indicate SD

