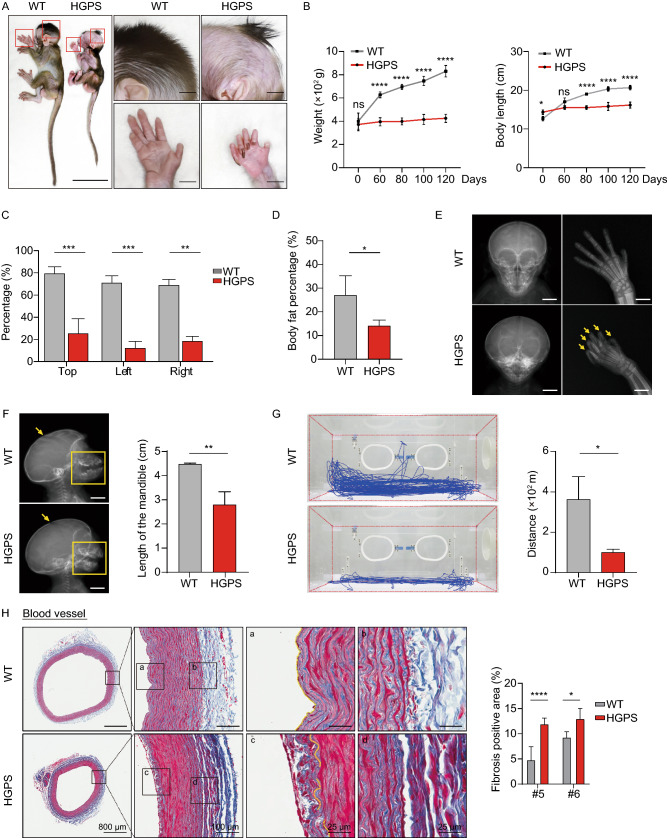
Figure 3.
HGPS monkeys exhibited clinical features of HGPS children. (A) Representative photographs showing the appearance of WT monkey (WT #6) and HGPS monkey (HGPS #6) at 87 days of age. The typical phenotypes of growth retardation, bone abnormalities, and hair loss were overserved in HGPS monkeys. Scale bar: left panel, 9 cm; right panels, 4.5 cm. (B) Body weight and length of WT and HGPS monkeys after birth. Data are displayed as mean ± SD, n = 3 (WT #1, #5, #6 versus HGPS #1, #5, #6), nsP > 0.5, *P < 0.5, ****P < 0.0001 (two-way ANOVA). (C) Quantitative analysis of hair loss in WT monkeys and HGPS monkeys at 100 days of age. The percentage of the area with hair was calculated in the top, left, and right side of the monkey head. Data were presented as mean ± SD, n = 3 (WT #1, #5, #6 versus HGPS #1, #5, #6), **P < 0.01, ****P < 0.0001 (one-way ANOVA). (D) Body fat percentage of HGPS monkeys and WT monkeys measured by dual-energy X-ray absorptiometry (DXA). Data were presented as mean ± SD, n = 3 or 5 (5 WT monkeys versus HGPS #1, #5, #6), *P < 0.5 (two-tailed Student’s t-test). (E) The radiographs of the skull anteroposterior of a WT monkey (WT #6) and a HGPS monkey (HGPS #6). Showing disproportionate large calvarium and contractures finger bone (indicated by yellow arrows) in the HGPS monkey. (F) The smaller mandible (yellow box) and open anterior fontanel (yellow arrow) of the HGPS monkey revealed by skull radiography. Data (right) were presented as mean ± SD, n = 3 (WT #1, #5, #6 versus HGPS #1, #5, #6), **P < 0.01 (t-test). (G) Decreased range of motion in HGPS monkeys determined by the motion tracking. Data are presented as mean ± SD, n = 3 (WT #1, #5, #6 versus HGPS #1, #5, #6), *P < 0.05 (t-test). (H) Masson’s trichrome staining of the aorta showing early features of atherosclerosis (c) and vascular fibrosis (d) in HGPS monkeys. Scale bar, 800 μm, 100 μm, 25 μm, 25 μm. n = 2 slices per monkeys (WT #5, #6 versus HGPS #5, #6). Data are mean ± SD, ****P < 0.0001 (one-way ANOVA)

