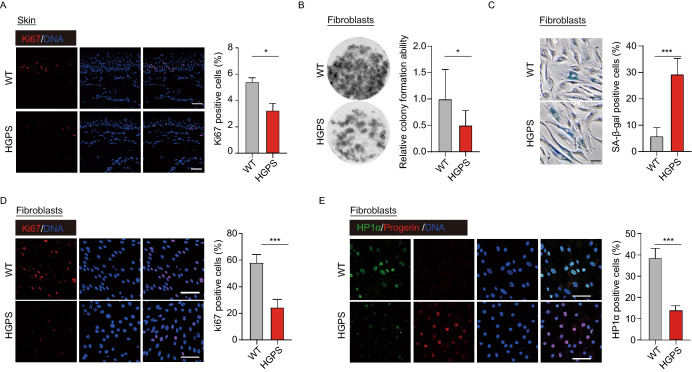
Figure 4.
LMNAG608G resulted the decrease of cell proliferation ability. (A) Immunofluorescence staining of Ki67 demonstrated reduced proliferation of HGPS monkeys’ skin cells. Scale bar, 25 μm. n = 4 (WT #1, #4, #5, #6 versus HGPS #1, #4, #5, #6). Data are mean ± sd., *P < 0.05 (t-test). (B) The clonal images showed reduced expansion ability of the HGPS monkeys’ fibroblasts (n = 4 monkeys WT #1, #4, #5, #6 versus HGPS #1, #4, #5, #6). Data are mean ± SD, *P < 0.05 (t-test). (C) Immunofluorescence staining of SA-β-gal demonstrated increased senescence of HGPS monkeys’ fibroblasts. Scale bar, 50 μm. n = 4 (WT #1, #4, #5, #6 versus HGPS #1, #4, #5, #6). Data are mean ± SD, ***P < 0.001 (t-test). (D) Immunofluorescence staining of Ki67 demonstrated a decrease in proliferation of HGPS monkeys’ fibroblasts. Scale bar, 75 μm. n = 4 (WT #1, #4, #5, #6 versus HGPS #1, #4, #5, #6). Data are mean ± SD, ***P < 0.001 (t-test). (E) HP1α’s immunofluorescence staining of fibroblasts demonstrated heterochromatin loss in HGPS monkeys. Scale bar, 75 μm. n = 4 (WT #1, #4, #5, #6 versus HGPS #1, #4, #5, #6). Data are mean ± SD, ***P < 0.001 (t-test)

