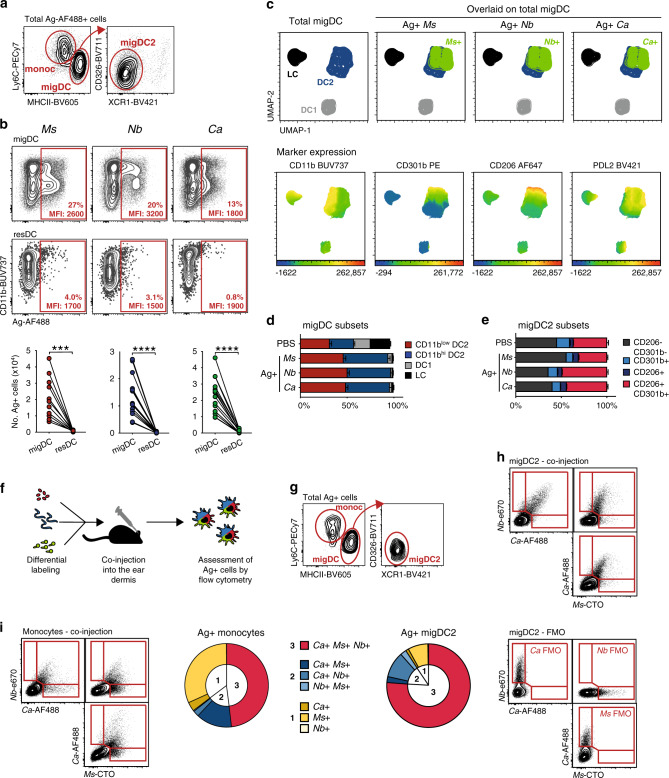
Fig. 1. Different types of pathogens can be simultaneously taken up by the same population of dermal migDC2.
C57BL/6 mice were immunized i.d. with fluorescently labeled Ms, Nb, Ca, or PBS as a control. Flow cytometry analysis was performed on LN cell suspensions 2 days after immunization. a Cellular composition and gating of the Ag+ population across treatment groups. b Uptake of different pathogens by migDC and resDC. Each symbol corresponds to one mouse. Data refer to groups of n = 11 (Ms) or 15 (Nb, Ca) female mice examined over 3 (Ms) or 4 (Nb, Ca) independent experiments. Statistical significance was assessed by paired two-tailed Student’s t test. ***p < 0.001, ****p < 0.0001. c UMAP analysis of concatenated multi-color flow cytometry data pre-gated on migDC from 4 immunized female mice per group. Analysis was performed on 161,125 cells using 11 parameters (FSC-A, SSC-A, CD11c, CD11b, CD103, CD206, CD301b, CD326, PDL2, MHCII, Ag-AF488) with the FlowJo 10 default settings (nearest neighbors = 15; minimum distance = 0.5; Euclidean distance function). Top panels highlight Ag+ cells (in green) from each treatment group overlaid on total migDC. Lower panels highlight the expression of CD11b, CD301b, CD206, and PDL2 across migDC populations using a rainbow heatmap scale. Data are representative of two independent experiments that gave similar results. d, e Distribution of Ag+ cells in migDC (d) and migDC2 (e) subsets across treatment groups compared to PBS-injected mice. Bar graphs in (d) show mean ± SEM for n = 17 (PBS), 20 (Ms), or 19 (Nb, Ca) female mice over five independent experiments. Bar graphs in (e) show mean ± SEM for groups of n = 9 (Ms and Nb) or 10 (PBS and Ca) female mice over two independent experiments. f Experimental outline and (g) gating strategy for assessing antigen uptake in mice co-injected with Ms-CTO, Nb-e670, and Ca-AF488. h, i Flow plots showing the relationship between Ms-CTO+, Nb-e670+, and Ca-AF488 + migDC2 (h) and monocytes (i). Pie charts summarize the proportion of cells positive for 1, 2, or 3 pathogens among total Ag+ migDC2 and monocytes. Data refer to groups of n = 5 female mice from one of 3 independent experiments that gave similar results. Source data are provided as a Source Data file.

