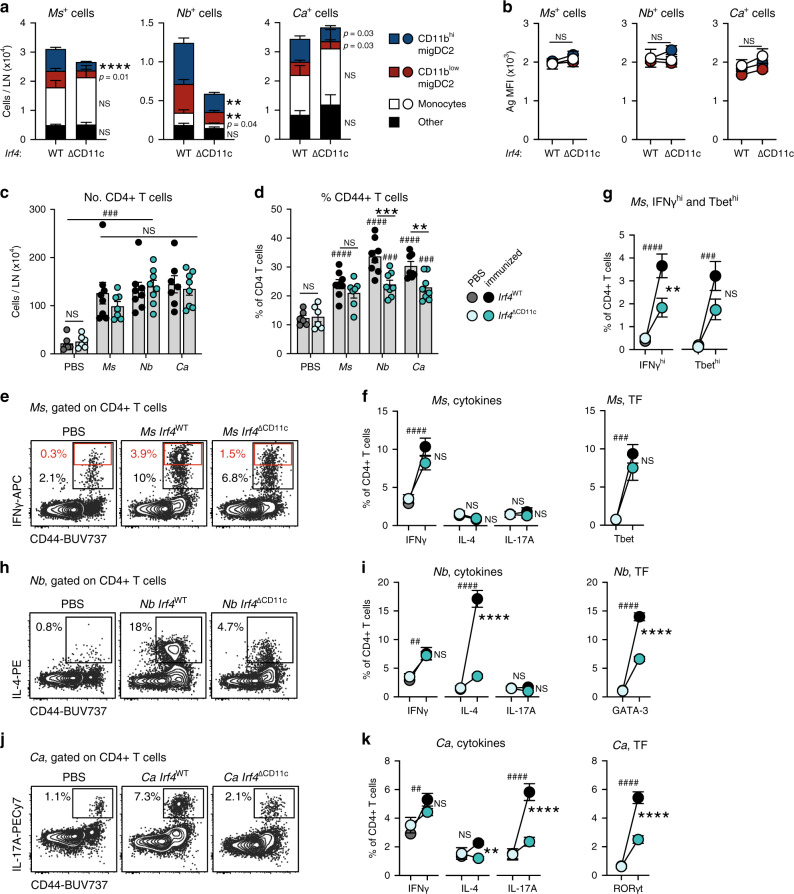
Fig. 3. MigDC2 are required for optimal IFNγ, IL-4, and IL-17A responses by CD4+ T cells.
IRF4WT→ or IRF4∆CD11c→ C57BL/6 bone marrow chimeras were immunized i.d. with Ms, Nb, Ca, or PBS as a control. LN cell suspensions were examined by flow cytometry on day 2 (a, b) or day 5 (c–k) after immunization. All conditions were compared within each experiment. a, b Cellular composition (a) and Ag median fluorescence intensity (MFI) (b) of LN Ag+ populations 2 days after immunization with CellTracker Orange-labeled Ms, Nb, or Ca. Graphs show mean ± SEM for groups of n = 9 (Ms and Nb IRF4WT) or 8 (Ca IRF4WT and all IRF4∆CD11c) female chimeras from two independent experiments. Statistical significance was assessed using a two-sided Student’s t test for each cell population. NS: not significant, **p < 0.01, ****p < 0.0001. Exact values are shown for 0.05 > p > 0.01. c–k CD4+ T cell responses as assessed by flow cytometry. Intracellular cytokine staining was after in vitro restimulation, transcription factor (TF) expression was assessed without in vitro restimulation. c Numbers of CD4+ T cells per LN and (d) frequencies of CD44+ cells in the indicated CD4+ T cell populations. Bar graphs show mean values ± SEM, each symbol corresponds to one mouse. e Contour plots showing IFNγ staining of CD4+ T cells from Ms-immunized mice. Data are concatenated from 4 mice. f Frequencies of total cytokine+ and Tbet+ CD4+ T cells, or (g) IFNγhi (red gates in (e)) and Tbethi CD4+ T cells, in Ms-immunized mice. h, j Contour plots showing IL-4 and IL-17A staining of CD4+ T cells from Nb- or Ca-immunized mice, respectively. Data are concatenated from 4 mice. i, k Frequencies of cytokine+ and TF+ CD4+ T cells in Nb- or Ca-immunized mice. All graphs show mean ± SEM for groups of n = 6 (PBS IRF4WT and PBS IRF4∆CD11c) n = 7 (Ca IRF4WT and Ms IRF4∆CD11c) or n = 8 (Ms, Nb IRF4WT and Nb, Ca IRF4∆CD11c) female chimeras over two independent experiments; each symbol in (c, d) corresponds to one mouse. Statistical significance was assessed using Two-Way ANOVA with Sidak’s post-test. NS: not significant; ##,**p < 0.01; ###,***p < 0.001; ####,****p < 0.0001. Hash symbols refer to comparisons between PBS and immunized chimeras of the same genotype. Asterisks refer to comparisons between similarly immunized IRF4WT or IRF4∆CD11c chimeras. Source data are provided as a Source Data file.

