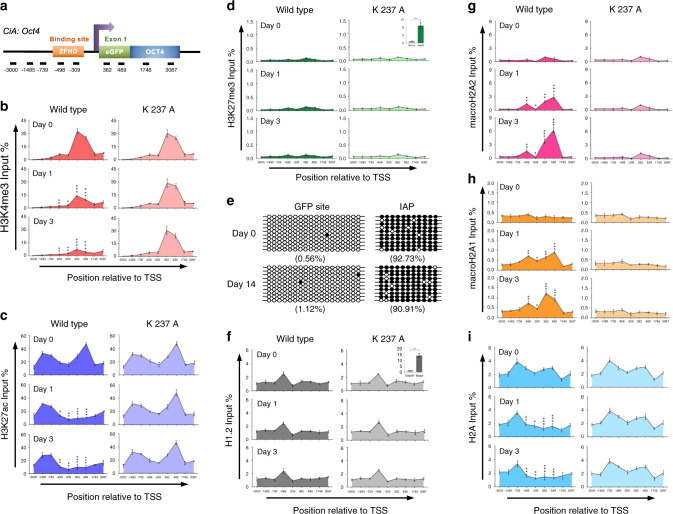
Fig. 2. LSH recruitment induces macroH2A deposition at the tethered locus.
a Schematic representation of primer location at the CiA: Oct4 allele; allele-specific primers at ZFHD binding (−498, −309) and eGFP sites (362, 489), and common primers of the Oct4 gene (−3000, −1485, −739, 1746, and 3087). b–d ChIP-qPCR analysis to assess the dynamic changes of histone modifications H3K4me3 (b), H3K27Ac (c), and H3K27me3 (d) at the CiA: Oct4 locus in the wild-type and ATP mutant LSH (K 237A) CIP systems after 0, 1, and 3 days of rapamycin treatment. Nanog and MyoD genes were used for H3K27me3 ChIP-qPCR results as negative and positive controls, respectively. *adjusted p < 0.05, **adjusted p < 0.01, and ***adjusted p < 0.001. e Bisulfite sequencing analysis shows no changes of CG methylation level at eGFP site following LSH recruitment by rapamycin for 14 days. IAP repeat sequence served as positive control for bisulfite sequencing analysis. The CpG methylation profiles are shown with black (methylated) and white (unmethylated) circles. Each sample included 10 sequenced clones and is represented as percentage of methylated CpGs. f–i ChIP-qPCR analysis to assess the dynamic changes of histones and variants H1.2 (f), macroH2A2 (g), macroH2A1 (h), and H2A (i) at the CiA:Oct4 locus in the wild-type and ATP mutant LSH (K 237A) CIP systems after 0, 1, and 3 days of rapamycin treatment. Gapdh and Major satellite genes were used as negative and positive controls for H1.2 ChIP-qPCR result. *adjusted p < 0.05, **adjusted p < 0.01 and ***adjusted p < 0.001. One-way ANOVA with Tukey’s multiple comparison test (b–d, f–i). b–d, f–i representative of three independent experiments. Data are represented as mean ± SD. Source data are provided as a Source Data file.

