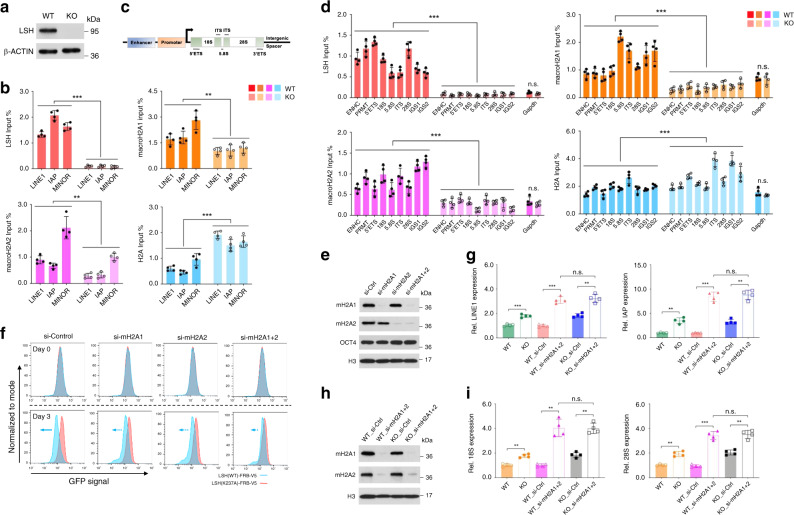
Fig. 3. LSH induced transcriptional repression is in part mediated by macroH2A.
a Western blot analysis for detection of LSH protein in Lsh WT and KO MEFs. b ChIP-qPCR analysis for detection of LSH (***p < 0.0001), macroH2A1 (**p = 0.0002), macroH2A2 (**p = 0.0002), and H2A (***p < 0.0001) enrichment at repeat sequences, including LINE1, IAP, and MINOR satellites, in KO MEFs compared to WT cells. c, d Schematic representation of mouse rDNA repeats (c). ENHC enhancer, PRMT promoter, ETS external transcribed spacer, ITS internal transcribed spacer, IGS intergenic spacer. ChIP-qPCR analysis for detection of LSH, macroH2A1, macroH2A2 and H2A enrichment at rDNA sequences in KO MEFs compared to WT MEFs (d). ***p < 0.0001, n.s. means not significant. e Western blot analysis to detect indicated proteins after single or combined depletion of macroH2A1 and macroH2A2 using siRNA in the wild-type LSH CIP system. Depletion of macroH2A histones did not affect Oct4 gene expression. f Flow cytometry to assess reporter-GFP expression in the wild-type LSH (blue) CIP system treated with control siRNA (si-Ctrl), macroH2A1 siRNA (si-mH2A1), macroH2A2 siRNA (si-mH2A2), or two combined siRNA (si-mH2A1 + 2) after 0 and 3 days of rapamycin addition. ATP mutant LSH (K 237A, red) CIP system was used as a negative control. g–i RT-qPCR analysis in Lsh WT and KO MEFs, or WT and KO MEFs treated with control siRNA (si-Ctrl) or two combined macroH2A siRNA (si-mH2A1 + 2) to compare the effects of LSH and macroH2A depletion on repeats (LINE1 and IAP, g) and rDNA (18S and 28S, i) transcription levels. Depletion of macroH2A proteins was confirmed by western blot analysis (h). **adjusted p < 0.01 and ***adjusted p < 0.001, n.s. means not significant. Data are represented as mean ± SD. Paired two-tailed Student’s t test (b, d); one-way ANOVA with Tukey’s multiple comparison test (g, i). b, d, g, i representative of four independent experiments. Source data are provided as a Source Data file.

