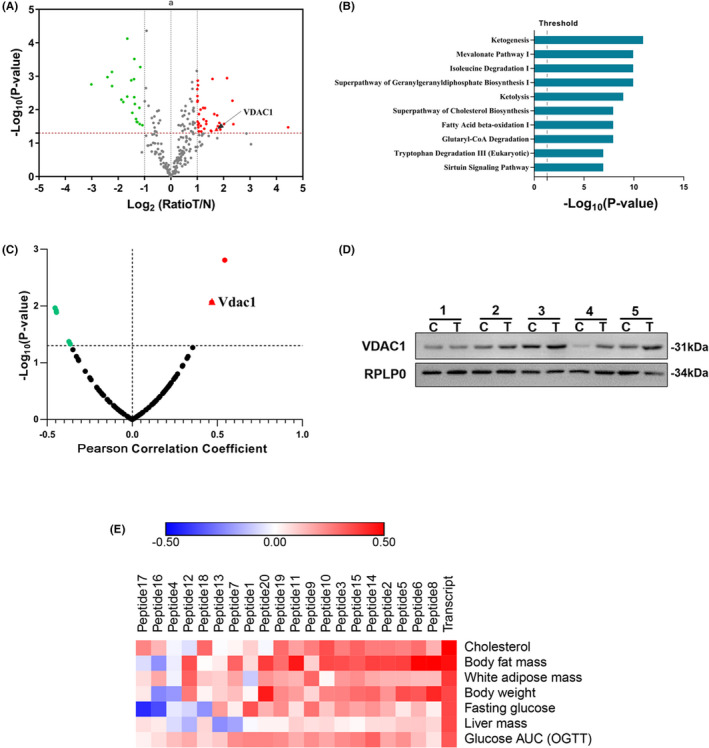
FIGURE 1.

VDAC1 is dysregulated in NAFLD‐driven HCC and associated with NAFLD. A, Volcano plot graph showing the differential expressed proteins in the quantitative analysis. The −log10(P‐value) was plotted against the log2 (ratio Tumor/Normal). The upregulated proteins in HCC tissues were marked with red dots, and the downregulated proteins in HCC tissues with green dots. B, Pathways analysis of significantly altered proteins. The canonical pathways associated with the differential proteins were tested alongside the P‐values calculated using right‐tailed Fisher exact test. The top 10 pathways were listed. C, Transcriptome‐wide association study suggested that VDAC1 was associated with NAFLD. The correlation between differentially expressed protein and the phenotype of body fat mass percentage (Record ID 12 919) was shown. The red plots indicated the positive correlation, the green plots indicated the negative correlation, and the dark plots indicated no statistical significance. A significant correlation with the VDAC1 (R = 0.469, P = .008) was shown in the red triangle. D, Overexpression of VDAC1 in tumor tissues was validated with western blot. C represented the HCC tissues, and N represented the adjacent normal tissues. RPLP0 is used as internal reference. E, Heat map showed that VDAC1 was associated with a serial of fatty liver disease phenotypes in both gene and protein expression level. The VDAC1 transcript had significant correlations with the body fat mass (R = 0.472, P = .008), body weight (R = 0.361, P = .049), liver mass (R = 0.358, P = .021), white adipose mass (R = 0.391, P = .035), cholesterol in plasma (R = 0.525, P = .0003), Glucose AUC in OGTT (R = 0.331, P = .034) and fasting glucose level (R = 0.298, P = .058). Red represents positive correlations, and blue represents negative correlations. Transcript and peptide 1‐20 represent the gene and peptides expression level, respectively. A, B, D, obtained from the proteomic analysis of human samples; C, E were obtained from the transcriptomic and proteomic analysis of BXD family samples
