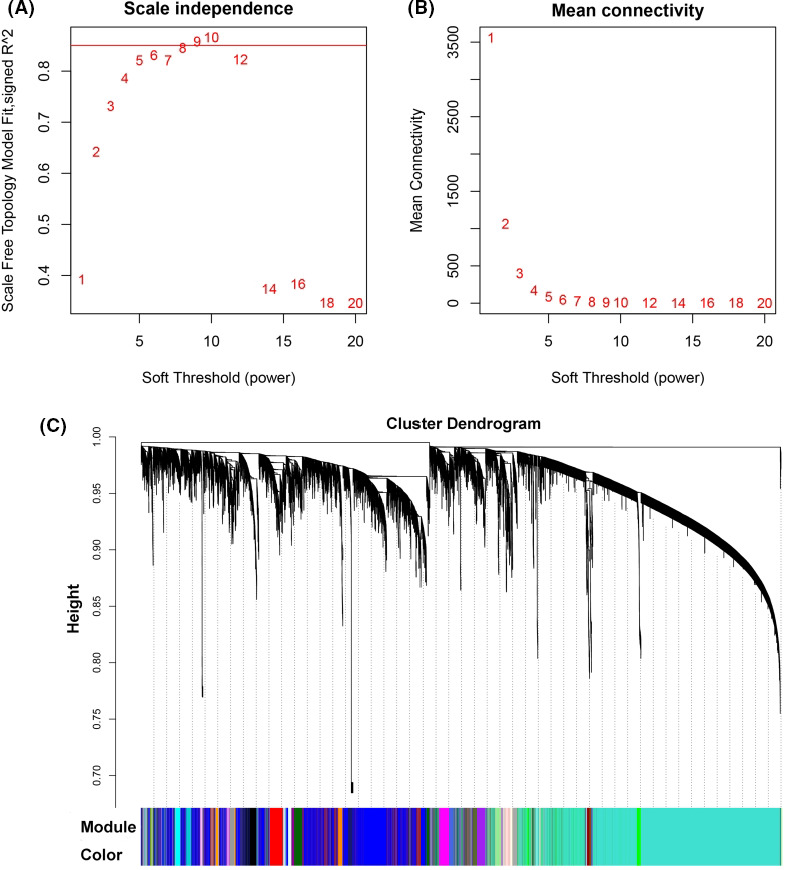
FIGURE 4.

Weighted gene co‐expression network analysis. A, Soft‐thresholding index R 2 (y‐axis) as a function of different powers β (x‐axis). B, Mean connectivity (degree, y‐axis) as a function of the soft‐thresholding power (x‐axis). C, 35 co‐expression modules identified from mice liver transcriptome data by dendrogram branch cutting
