
FIGURE 6.
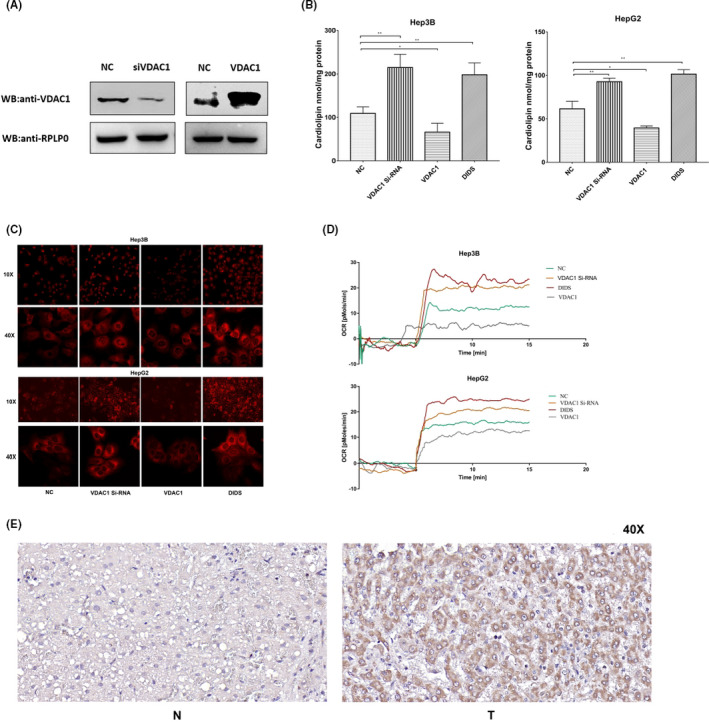
Mitochondrial function analysis with or without VDAC1 expression in Hep3B and HepG2. A, Western blot analysis of VDAC1 level in HepG2 cells after transfection of VDAC1 siRNA and VDAC1 expression plasmid. Compared with the negative control, the expression level of VDAC1 reduced in the knockdown group, and increased in overexpression group. RPLPO was the internal reference protein. B, Determination of cardiolipin in Hep3B and HepG2 cells. Cardiolipin was measured using the fluorometric probe assay kit (ab241036). The left panel shows the cardiolipin content in Hep3B. Compared with the NC group, the cardiolipin contents both in knockdown group and inhibitor group were significantly higher (P < .01), and the cardiolipin content in overexpression group was lower (P < .05). The right panel showed the cardiolipin content in HepG2. Compared with the NC group, the cardiolipin contents both in knockdown group and inhibitor group were significantly higher (P < .01), and the cardiolipin content in overexpression group was lower (P < .05). C, Detection of cardiolipin levels in HepG2 and Hep3B by NAO staining. Compared with negative control, the fluorescence intensity increased in the knockdown group and inhibitor group, and decreased in the overexpression group both in Hep3B and HepG2. The fluorescence intensity of the 2 cell lines was observed under a microscope at ×10 and ×40 magnification, respectively. D, Detection of mitochondrial respiratory function in Hep3B and HepG2 cells. High‐resolution respirometry performed in an Oroboros Oxygraph‐2k. The different color curves showed the mitochondrial oxygen consumption of the different groups. In Hep3B cells, the OCR of knockdown group and inhibitor group were higher than the NC group, and the OCR of overexpression group and inhibitor group was lower than the NC group. Also, the same trend was shown in HepG2 cells. E, Relative VDAC1 expression was detected by IHC between NAFLD‐driven HCC and adjacent non‐tumor liver tissues (×40). N represented the VDAC1 in adjacent non‐tumor liver tissues. T represented the VDAC1 in NAFLD‐driven HCC tissues. (NC represented the negative control group; VDAC1 siRNA represented VDAC1 knockdown group; VDAC1 represented the overexpression group and DIDS represented the inhibitor group)