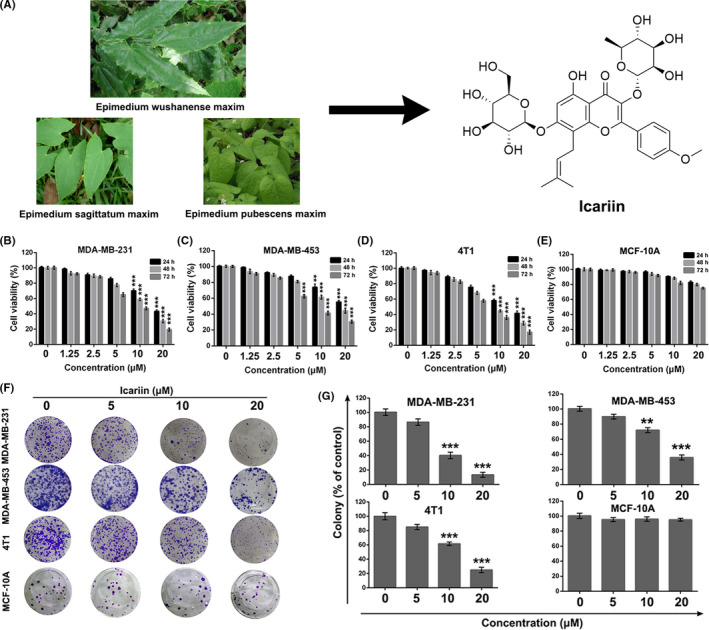
FIGURE 1.

Icariin selectively inhibited breast cancer cell proliferation in vitro. A, Natural resources and chemical structure of icariin. B‐E, Cell viability analysis of MDA‐MB‐231, MDA‐MB‐453, 4T1, and MCF‐10A after treatment with indicated concentrations of icariin for 24, 48, or 72 h by MTT assay. F, G, Colony formation of MDA‐MB‐231, MDA‐MB‐453, 4T1, and MCF‐10A after treatment with different concentrations of icariin. Bars represent means ± SD of at least 3 independent experiments; *, P < .05, **, P < .01 and ***, P < .001 compared with the control group
