
FIGURE 4.
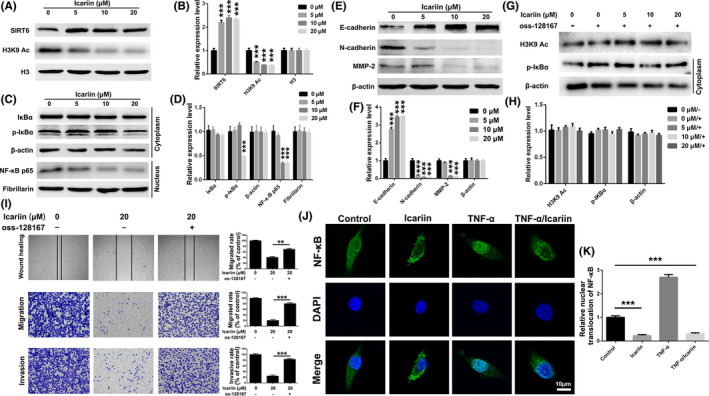
Icariin suppressed breast cancer cells (4T1) migration and invasion via the SIRT6/NF‐κB/EMT signaling pathway. A, B, Levels of SIRT6 and acylated H3K9 of icariin‐treated cells determined by western blot analysis. C, D, Expression levels of NF‐κB associated proteins of icariin‐treated cells determined by western blot analysis. E, F, Expression levels of EMT‐associated proteins of icariin‐treated cells determined by western blot analysis. G, H, Levels of acylated H3K9 and p‐IκBα of icariin‐treated cells that were pre‐treated with oss‐128167 (20 μM) and determined by western blot analysis. I, Wound healing, transwell migration, and transwell invasion assessment of icariin in MDA‐MB‐231 cells with or without pre‐treatment with oss‐128167. J, Immunofluorescence analysis of nuclear transportation of NF‐κB p65 protein in MDA‐MB‐231 cells. K, Statistical analysis of nuclear translocation of NF‐κB p65. Bars represent means ± SD of at least 3 independent experiments. *, P < .05, **, P < .01 and ***, P < .001 in comparison with the control group