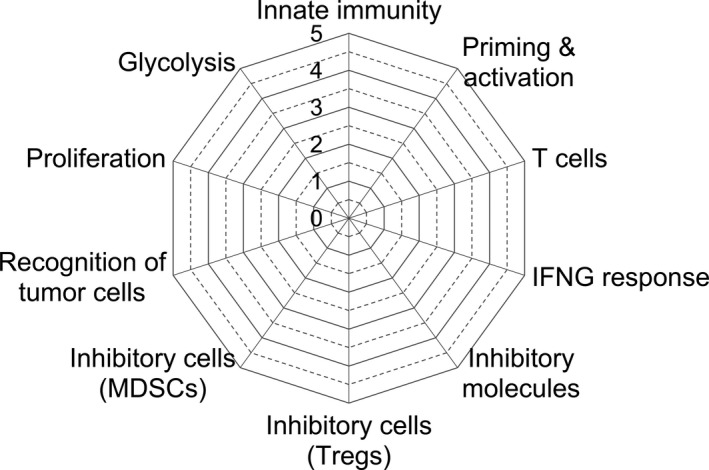
Figure 1.

Immunogram radar plots. To depict the molecular profiles of the tumor microenvironment in each patient, 10 parameters related to this process were scored and plotted on the radar plot. These consist of innate immunity (axis 1), priming and activation (axis 2), T cell response (axis 3), IFNG response (axis 4), inhibitory molecules (axis 5), regulatory T cells (Treg, axis 6), myeloid‐derived suppressor cells (MDSCs, axis 7), recognition of tumor cells and presentation (axis 8), proliferation (axis 9), and glycolysis (axis 10), all relevant for the development of antitumor immune responses
