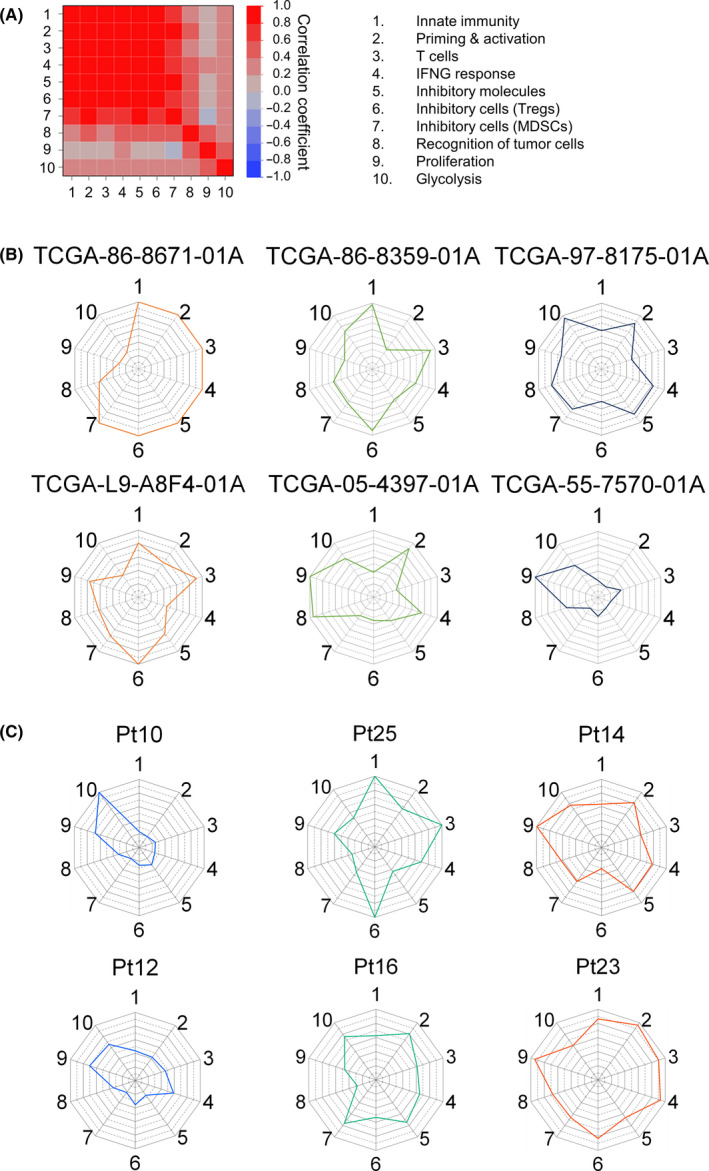
Figure 5.

Immunograms for individual patients. A, Immunogram scores of each axis from 9417 patients’ data were subjected to Spearman correlation analysis. Pairwise correlation analyses of each axis of the immunogram are represented in the heatmap matrix that contains all the pairwise data of the indicated axes. Bivariate correlations for the dataset are shown with a color coding as follows: dark red is associated with Spearman correlation coefficient, R, equal to 1 and dark blue is associated with R = −1. B, Lung cancer–specific immunograms of six patients. The Cancer Genome Atlas (TCGA) case IDs are shown in the panel. C, Immunograms of melanoma patients who received anti‐PD‐1 therapy (cohort of Hugo et al 29 ). Six nonresponders were shown. See also Fig. S2. 1. Innate immunity, 2. Priming & activation, 3. T cells, 4. IFNG response, 5. Inhibitory molecules, 6. Inhibitory cells (Tregs), 7. Inhibitory cells (MDSCs), 8. Recognition of tumor cells, 9. Proliferation, 10. Glycolysis
