FIGURE 4.

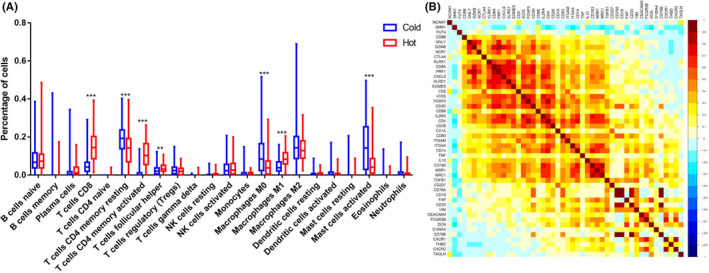
A, The differences in immune infiltration between the 2 groups (***P < .0001, **P < .001). B, Correlation analysis between CXCL9 and immune infiltration

A, The differences in immune infiltration between the 2 groups (***P < .0001, **P < .001). B, Correlation analysis between CXCL9 and immune infiltration