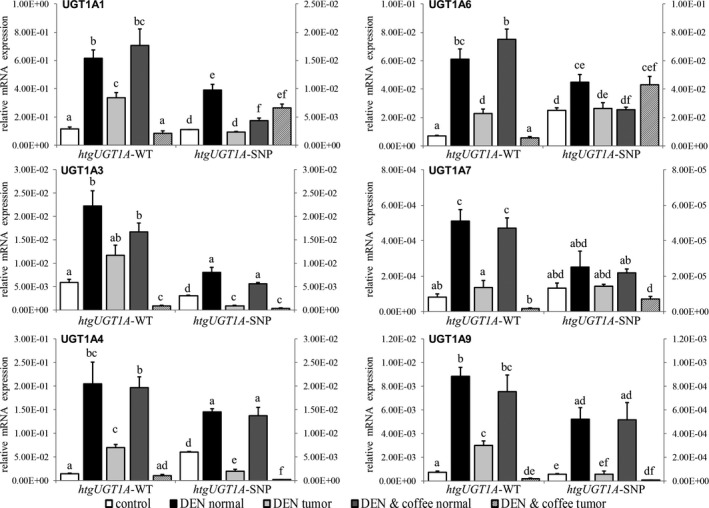
Figure 4.

Hepatic UGT1A expression levels of htgUGT1A mice 40 wk after diethylnitrosamine (DEN)‐induced hepatocarcinogenesis. The graphs illustrate the mRNA expression of UGT1A genes relative to mouse β‐actin measured in normal or tumor tissue of DEN‐ and coffee + DEN‐treated htgUGT1A–wild‐type (WT) and single‐nucleotide polymorphism (SNP) mice. Values for htgUGT1A‐WT mice refer to the left y‐axis, those of htgUGT1A‐SNP mice refer to the right y‐axis. Significantly higher absolute expression levels were detected in htgUGT1A‐WT mice. No UGT1A induction was measured in normal liver tissue after DEN + coffee cotreatment. Except for UGT1A1 and UGT1A6 expression in htgUGT1A‐SNP mice, lower transcriptional activation was detected within tumor tissue. Each column represents the mean ± standard deviation. Groups without the same letter are significantly different; P < 0.006 was considered statistically significant
