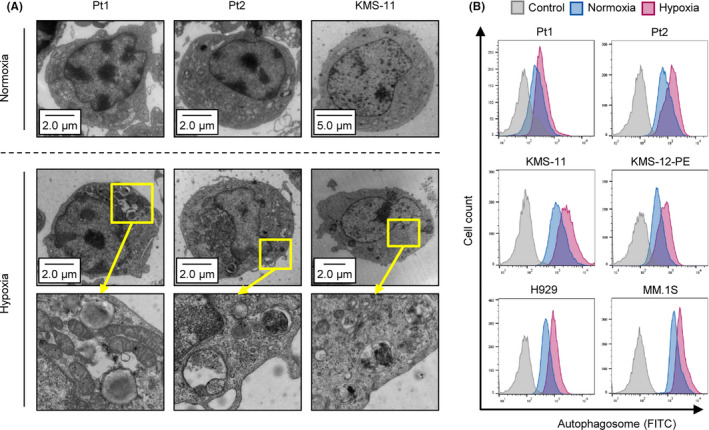
FIGURE 1.

Hypoxia‐inducible autophagy in MM. A, Photograph of electron microscopy for 2 primary MM samples and a myeloma cell line KMS‐11 cultured under normoxia or hypoxia (1% O2) for 48 h. B, Flow cytometry assay of autophagosome stained with DAPGreen in patient samples (n = 2) and the indicated 4 myeloma cell lines cultured under normoxia or hypoxia (1% O2) for 48 h. y‐axis: cell count, x‐axis: autophagosome‐FITC
