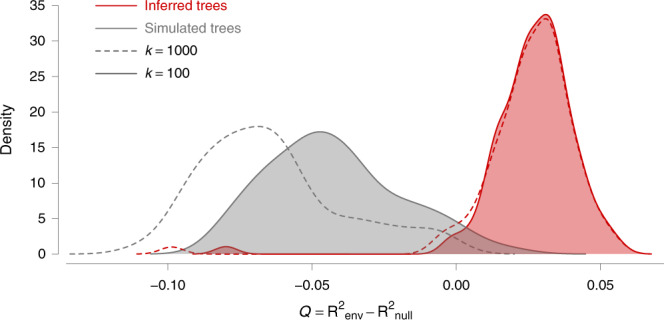
Fig. 4. Impact of annual mean temperature acting as a conductance factor on the dispersal velocity of viral lineages.

The graph displays the distribution of the correlation metric Q computed on 100 spatially annotated trees obtained by continuous phylogeographic inference (red distributions). The metric Q measures to what extent considering a heterogeneous environmental raster, increases the correlation between lineage durations and environmentally scaled distances compared to a homogeneous raster. If Q is positive and supported, it indicates that the heterogeneity in lineage dispersal velocity can be at least partially explained by the environmental factor under investigation. The graph also displays the distribution of Q values computed on the same 100 posterior trees along which we simulated a new forward-in-time diffusion process (grey distributions). These simulations are used as a null dispersal model to estimate the support associated with the inferred distribution of Q values. For both inferred and simulated trees, we report the Q distributions obtained while transforming the original environmental raster according to two different scaling parameter k values (100 and 1000; respectively full and dashed line, see the text for further details on this transformation). The annual mean temperature raster, transformed in conductance values using these two k values, is the only environmental factor for which we detect a positive distribution of Q that is also associated with a strong statistical support (Bayes factor > 20).
