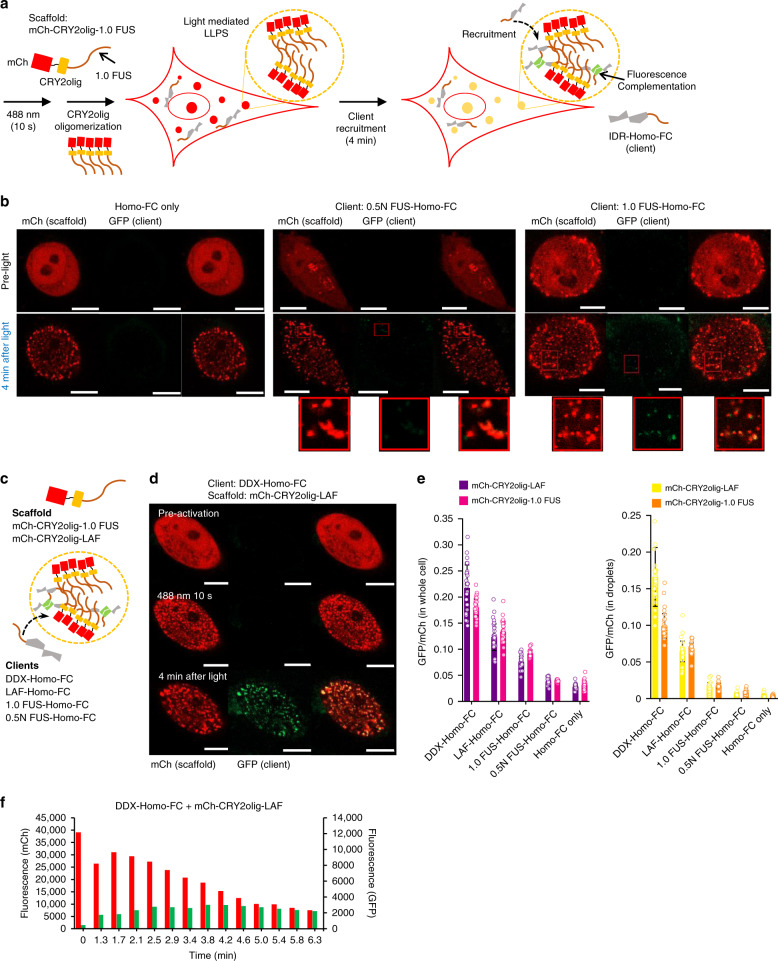
Fig. 4. Real-time observation of fluorescence complementation inside light-induced IDR compartments.
a Schematic illustration of light-induced cellular condensate formation of mCh-CRY2olig-1.0 FUS, 0.5 N FUS–Homo-FC recruitment, and subsequent client complementation for (green) fluorescence turn-on. b Fluorescence images of cells expressing mCh-CRY2olig-1.0 FUS (scaffold) with client Homo-FC only (left), 0.5 N FUS–Homo-FC (middle), and 1.0 FUS–Homo-FC (right) before and after 10 s 488 nm light activation and 4 min incubation. c Schematic illustration of light-inducible cellular condensates with two kinds of scaffolds and four different Homo-FC clients with various IDPs. d Fluorescence images of cells expressing mCh-CRY2olig-LAF (scaffold) with client DDX-Homo-FC before and after 10 s 488 nm light activation, followed by 4 min incubation. e Total GFP(complemented Homo-FC)-to-mCh ratios for whole cells (left) or condensates (right) with various combinations of IDP scaffolds and clients. Data are presented as mean values with ±1 SD as error bars (n = 33 cells from three independent experiments). f Scaffold (mCh) and client complementation (GFP) signal changes inside condensates at various time points after 10 s light activation. Scale bars: 10 μm.

