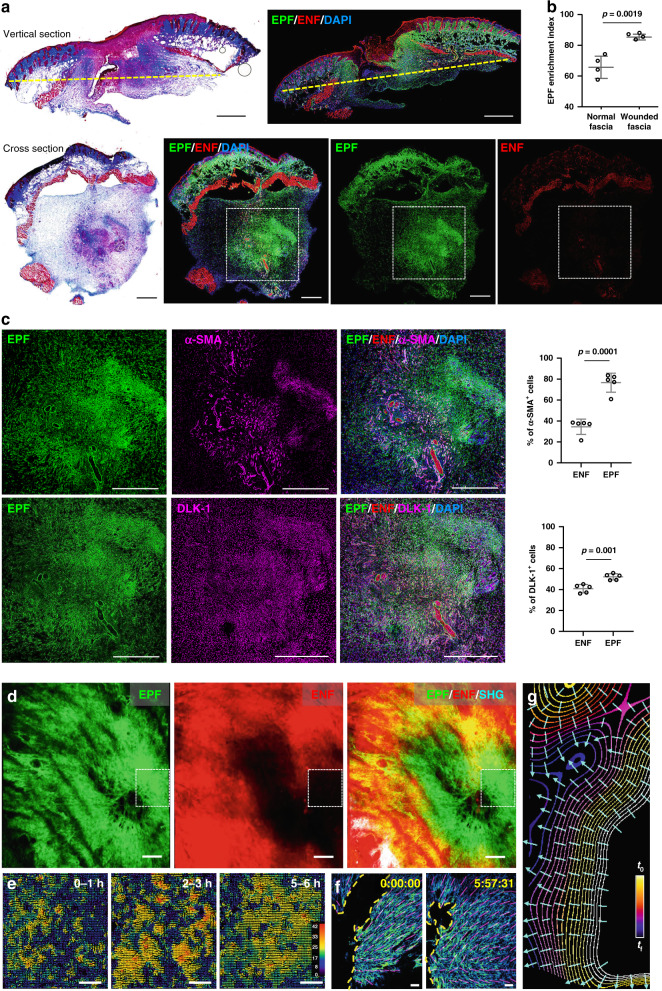
Fig. 1. Collective migration of fascia EPFs in physiological in vivo wounds.
a Masson’s trichrome staining and fluorescence images of vertical sections and transverse cross sections of wounds at 7-dpi from En1Cre,R26mTmG mice. EPFs were shown in green, ENFs in red, nuclei stained with DAPI in blue. The yellow dashed lines in vertical sections indicate the position of the cross sections. b EPF enrichment index in uninjured normal fascia or wounded fascia. Mean ± SD, p = 0.0019, unpaired two-tailed t-test, n = 4. c Immunolabelling of α-SMA or DLK-1 in magenta of boxed area showed in a, and quantification of the percentages of α-SMA+ or DLK-1+ cells in EPFs and ENFs. Mean ± SD, unpaired two-tailed t-test, p = 0.0001 (α-SMA), p = 0.001 (DLK-1), n = 5. d 3D image of in vivo wound at 14-dpi on the back of En1Cre;R26mTmG mice. White boxes indicate field of view for intravital live imaging (Supplementary Movie 1) and particle image velocity (PIV) analysis. Images are representative of three biological replicates. e PIV analysis of EPF migration over the indicated time. The colour-coded vectors indicate the direction and displacement in pixels. f EPF channel of the first and last frames of the intravital recording (Supplementary Movie 2). The yellow dash lines indicate the leading front of invading fibroblasts, purple lines are predicted EPF cell orientation. g Contour lines are smoothened EPF leading front in selected frames from the intravital recording. Colours indicate time, bright for the beginning (t0) and dark for the end (tf). Cyan lines are predicted trajectories of EPF swarm that are perpendicular to contour lines. Scale bars: a, b, d = 500 µm; e, f = 50 µm.

