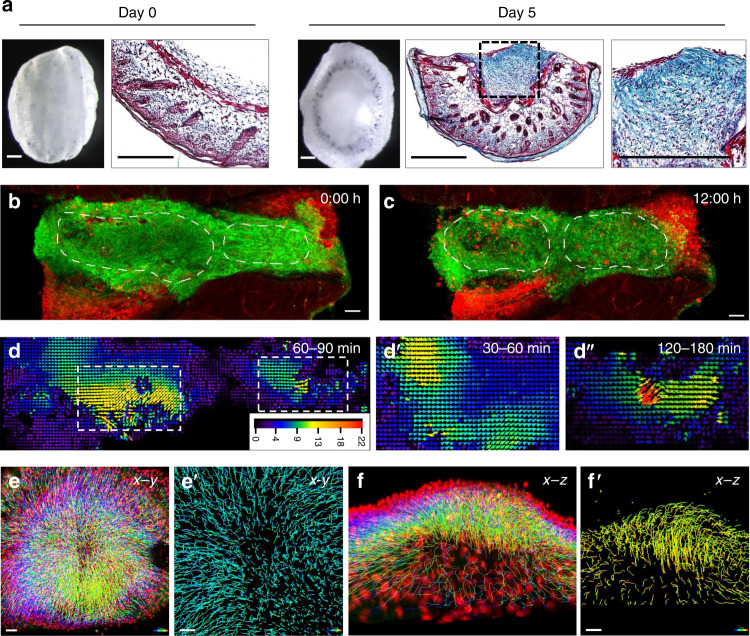
Fig. 2. Fascia EPFs swarm during scarring in SCAD.
a Whole-mount bright-field images and Masson’s trichrome staining with collagen in blue of fresh SCAD (day 0) and after 5-day culture (day 5). n > 1000. b, c Snapshots of live imaging of day 3 En1Cre;R26mTmG SCAD. Two independent EPF aggregates are encircled with a dotted line at time t = 0 h (b) and t = 12 h (c) (Supplementary Movie 4). Images are representative of four biological replicates. d PIV analysis of GFP channel from live imaging showed in Supplementary Movie 4. Arrowheads indicate the direction of particle movement. Particle velocity is indicated by a scale from slow (blue) to fast (red). Scale bar unit: pixel. d′–d″ Vector map from PIV analysis of the left swarm over 30–60 min (d′) and of the right swarm over 120–180 mins (d″). e, f Colour-coded tracking of EPFs from live imaging (72–96 h) of En1Cre;R26LSL-H2B-mCherry SCAD, from top view (e) and side view (f). Colours indicate time, starting from blue to red at the end of the movie (Supplementary Movie 6). e′ Enlarged images of EPF migration tracks in the scar centre at the beginning of swarming (blue-to-cyan). f′ Enlarged images of EPF migration tracks at the end of swarming (green-to-orange). Images are representative of four biological replicates. Scale bars: a = 500 µm; b, c, e, f = 50 µm; e′, f′ = 30 µm.

