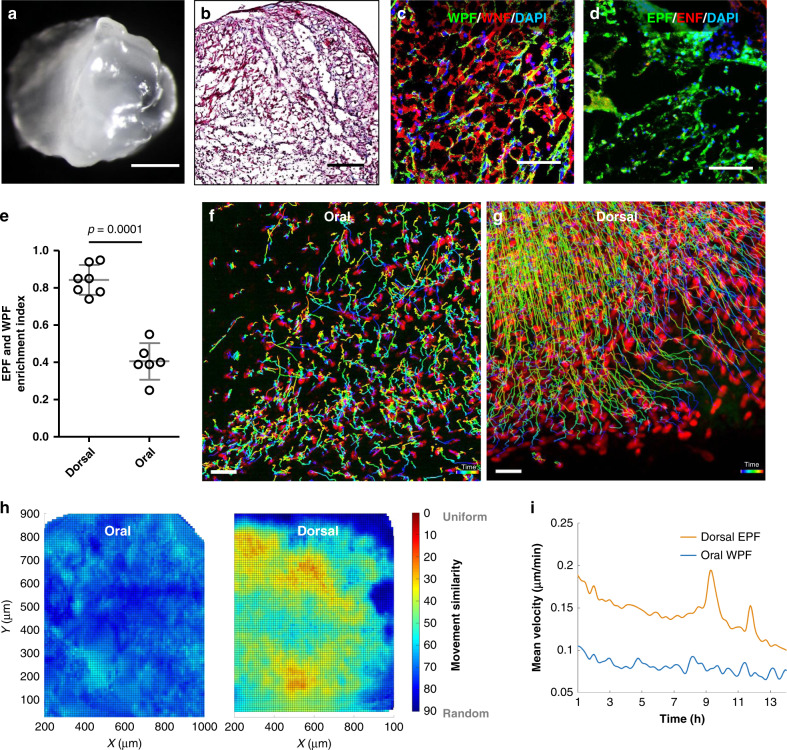
Fig. 3. Fibroblast swarms are absent from oral mucosa SCAD.
a, b Whole-mount bright-field image (a) and Masson’s trichrome staining (b) of SCAD from buccal mucosa. n > 30. c, d Fluorescence images of SCAD from Wnt1Cre;R26mTmG buccal mucosa (c) and En1Cre;R26mTmG back-skin (d). e EPF and WPF enrichment index in day 5 En1Cre;R26mTmG dorsal SCAD or Wnt1Cre;R26mTmG oral SCAD, respectively. Mean ± SD, unpaired two-tailed t-test, p = 0.0001, n = 7/6. f, g Colour-coded tracking of WPFs in oral SCAD (f, Supplementary Movie 8) or tracking of EPFs in dorsal SCAD (g) on a mCherry nuclear reporter (72–96 h). The colour indicates the time, with purple at the beginning and red at the end of the movie. Images are representative of three biological replicates. h Movement similarity between WPF and EPF tracks is visualised in a scale from 0 (red, uniform migration) to 90 (blue, random migration). i Comparison of velocities of WPFs in oral SCADs (blue) versus fascia EPFs in dorsal SCAD (orange) over time. Lines shown are smoothing lines over all velocity values at each time point. Scale bars: a = 500 µm; b = 200 µm; c, d = 50 µm; f, g = 30 µm.

