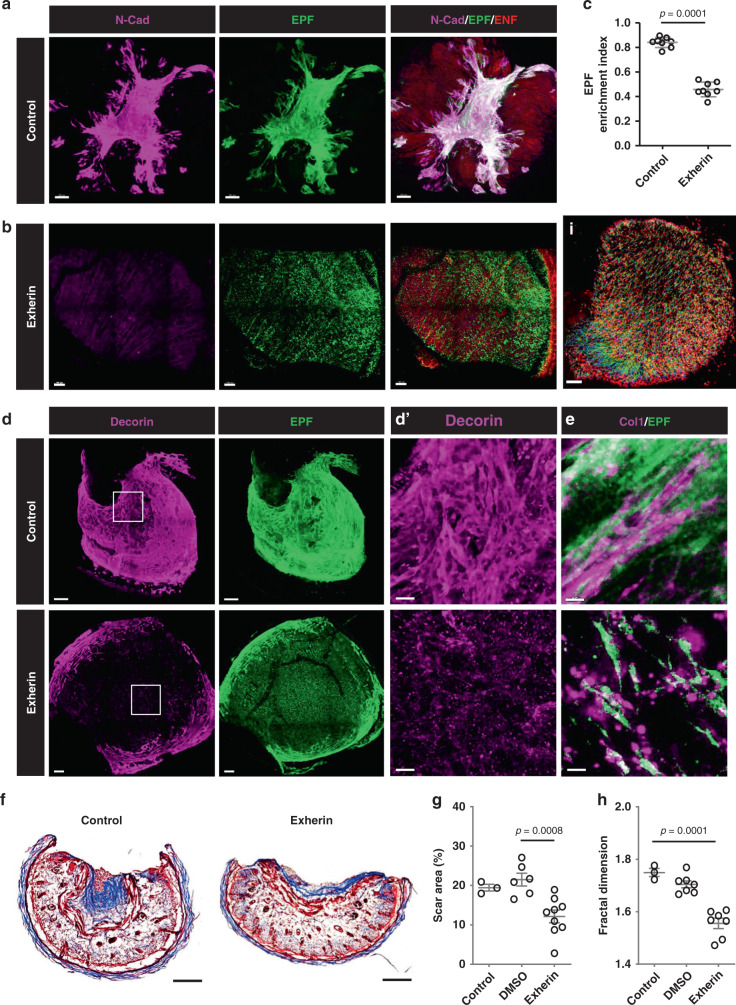
Fig. 4. Fibroblast swarms are driven by N-cadherin.
3D immunolabelling of N-cadherin (magenta) in control (a) or 500 µg/ml Exherin treated (b) En1Cre;R26mTmG SCAD. c EPF enrichment index in control or Exherin-treated SCAD. Mean ± SD, p = 0.0001, unpaired two-tailed t-test, n = 8. 3D immunolabelling of decorin (d) or collagen I (e) in a control (upper panel) or Exherin-treated (lower panel, Supplementary Movie 10) SCAD. d′ High magnification of white box in d. f Masson’s trichrome staining of control (upper) or Exherin-treated (lower) SCAD. g Scar areas of control, or DMSO treated or Exherin-treated SCADs. One-way ANOVA Tukey’s test, p = 0.0008, n = 3/6/9. h Fractal dimension analysis of control, or DMSO treated or Exherin-treated SCADs. One-way ANOVA Tukey’s test, p = 0.0001, n = 3/7/7. i Colour-coded tracking of fascia EPFs from live imaging (72–96 h) of 500 µg/ml Exherin-treated En1Cre;R26LSL-H2B-mCherry SCAD. Colours indicate time, starting from blue to red at the end of the movie (Supplementary Movie 11). Scale bars: a, b, d, i = 100 µm; d′ = 20 µm; e = 50 µm.

