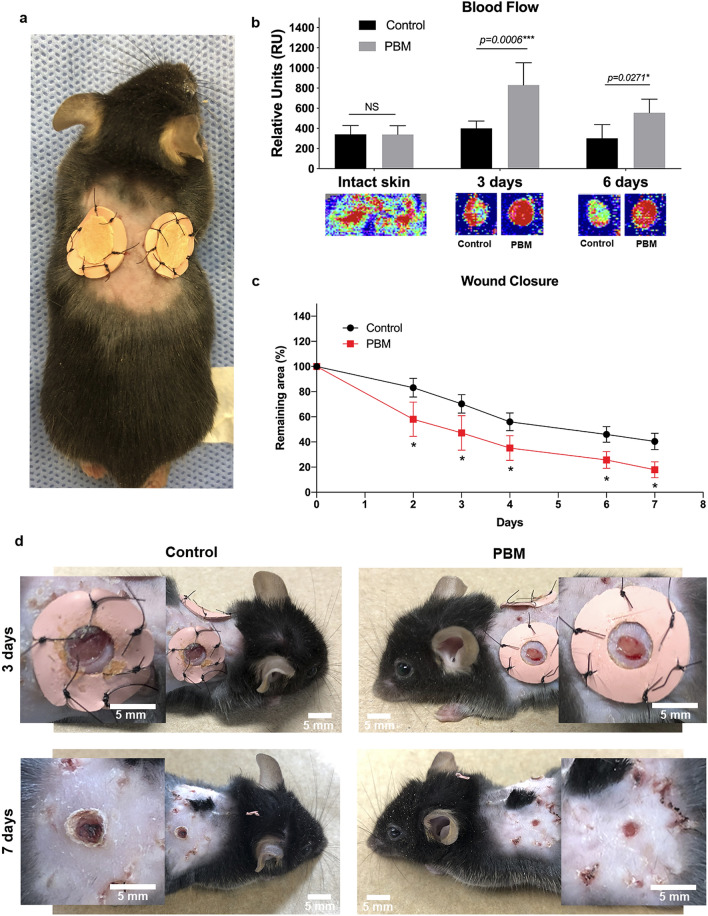
Figure 2.
Healing pattern of the wounded skin over time. Skin wound healing model (a). Blood flow evaluation in control and PBM-treated wounds at baseline, day 3, and day 6 post-surgery. Red colors below the bars represent greater blood flow, while turbulent flow is represented in yellow or green (b). Remaining wound area (%) for total closure from day 2 until day 7 (c). Macroscopic appearance of control and PBM-treated wounds at days 3 and 7. Note that PBM-treated wounds are humid and with less rolled edges—3rd day; smaller, more uniformly healed and thinner eschar than the control at day 7 (d). Data are shown as the mean ± SD, n = 5 for each group. N.S. = non-significant. Scale bar = 5 mm.

