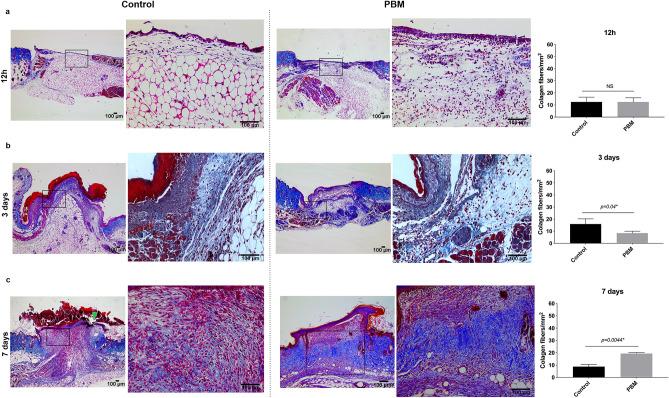
Figure 6.
PBM effects on Type I collagen fibers deposition. Masson trichrome stain in the control and PBM-treated wounds at experimental times 12 h (a), 3 days (b), and 7-days interval (c). The squared region is depicted in higher magnification (× 200) in the following image. The green arrow ((c), first image) points to an ulcerative region in the control wound. Bar graphs demonstrate the comparison of collagen fibers quantification between the PBM-treated and control wounds. Data are shown as the mean ± SD, n = 5 for each group. N.S. non-significant. Scale bar = 100 µm.

