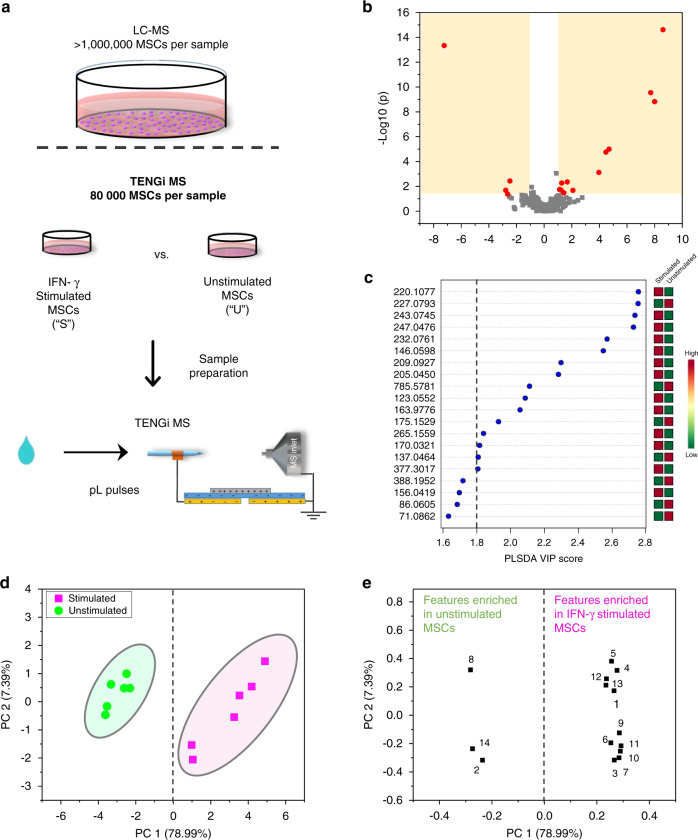
Fig. 7. TENGi sub-nanoliter metabolomic studies of IFN-γ-stimulated MSCs.
a TENGi MS workflow; b volcano plot for IFN-γ stimulated (S) vs. unstimulated (U) MSCs. c PLS-DA VIP score plot with the top 20 features ranked by their PLS-DA VIP scores. d Principal component analysis score plot for IFN-γ stimulated vs. unstimulated MSCs using 14 significant features selected by volcano plot criteria and PLS-DA VIP score > 1.8; e corresponding principal component analysis score loadings plot identifying features that discriminate stimulated vs. non-stimulated MSCs.

