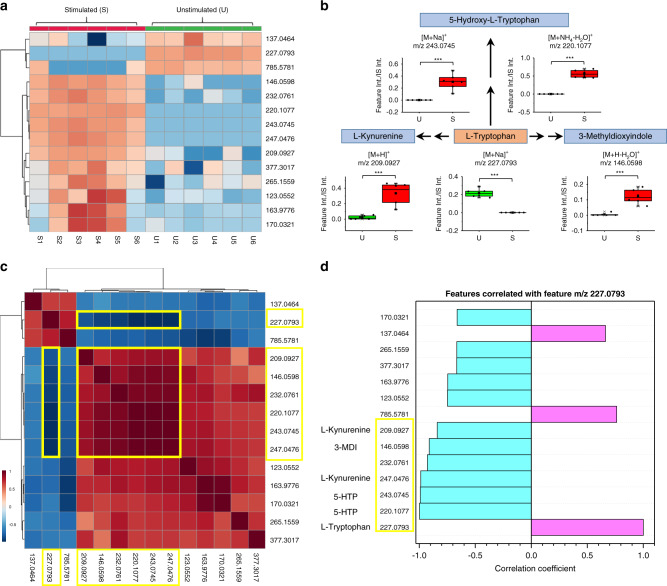
Fig. 8. IFN-γ stimulation affects tryptophan metabolism in MSCs through three catabolic pathways.
a Heat map of the top 14 most important features. b Pathway analysis results, showing three catabolic pathways are affected. Box plots shows the alterations in these tryptophan-related metabolites. Differences between the two groups were evaluated using the two-tailed Student’s t-test (***p-value < 0.001, detailed p-values of each feature: top left to right: 2.9E − 10, 2.5E − 15; bottom left to right: 7.6E − 04, 4.6E − 14, and 1.8E − 05. These are also provided in Table 1. P-values were calculated on the final dataset after G-log transformation and autoscaling through MetaboAnalyst). Source data are provided as Source Data files. The lower, middle, and upper lines in the box plots (in b) correspond to 25th, 50th, and 75th percentile. The whiskers extend to the most extreme data point within 1.5 IQR. n = 6 biologically independent samples were included in each group. c Pearson’s correlation map for the 14 feature set. d Pearson’s correlation coefficient between the 14 features of interest relative to m/z 227.0793 (tryptophan). Plots c and d show that there are six features closely correlated with m/z 227.0793 (tryptophan), five of which are from tryptophan catabolic products shown in b pathway analysis. Yellow squares indicate the metabolites that are highly correlated. Note 5-HTP has two ion forms as does l-kynurenine. Due to space limitations, b only shows the box plot of [M + H]+ (m/z 209.0927), the [M + K]+ (m/z 247.0476) ion is shown in Supplementary Fig. 11.

