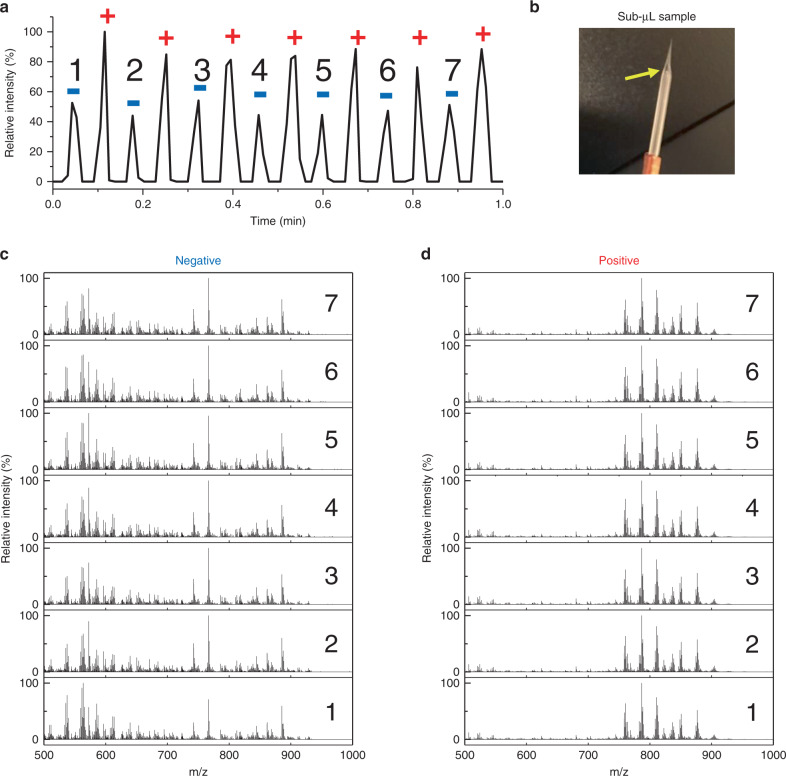
Fig. 9. Polarity switching TENGi MS to obtain both positive and negative signals in the same experiment with sub-nanoliter sample consumption.
The sample tested was a 50 μg mL−1 liver lipid extract. a TIC of TENGi coupled with polarity switching, Negative (blue “−” sign) and positive (red “+” sign) signals are detected alternatively. b Detail of emitter with 0.8 μL sample loaded. Yellow arrows indicate the position of the sample solution in the emitter. c Mass spectra for negative pulses; d mass spectra for positive pulses.

