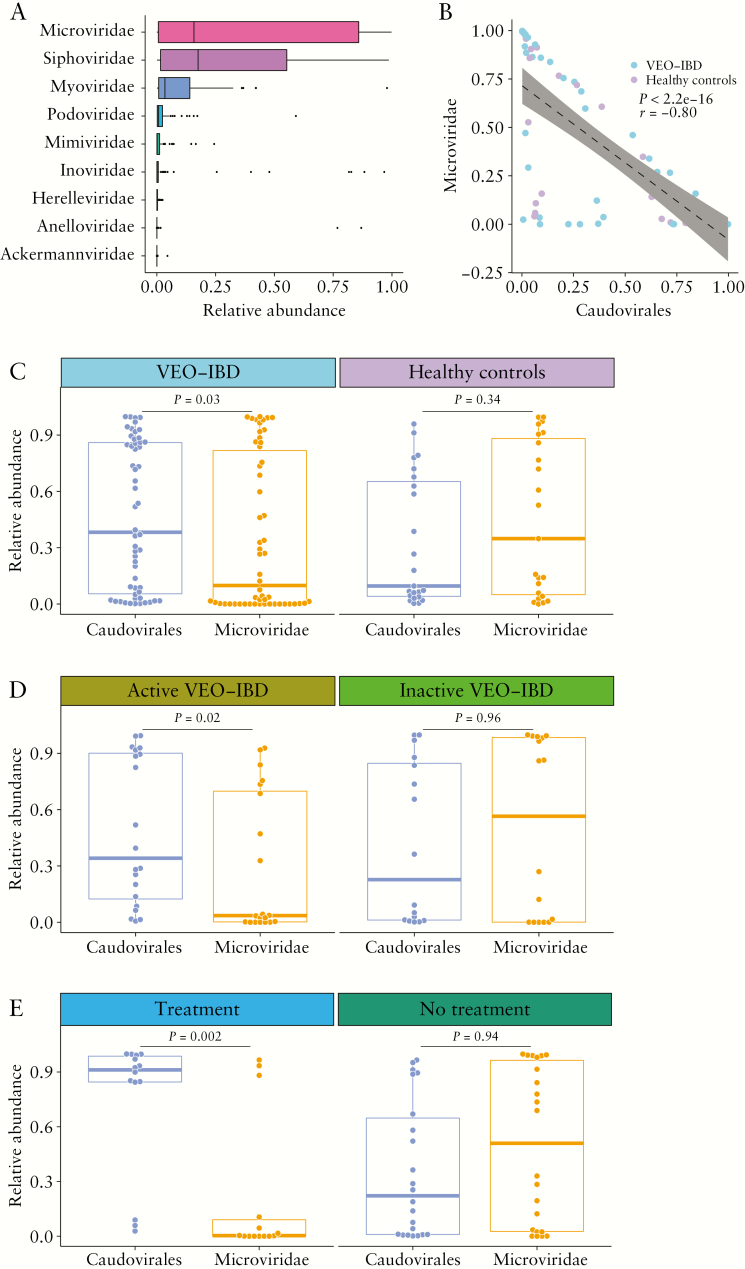
Figure 2.
Comparing bacteriophage populations in samples from VEO-IBD patients vs healthy controls. [A] Boxplot of the relative abundance of different viral taxa at the family level. [B] Correlation between the abundance of Caudovirales and Microviridae. The p- and r-values were calculated by Spearman’s correlation test. Linear regression with 95% confidence interval is shown. [C] Comparison between the abundance of Caudovirales and Microviridae in VEO-IBD patients [n = 54] and healthy controls [n = 23]. [D] Comparison between the abundance of Caudovirales and Microviridae in active VEO-IBD patients [n = 20] and inactive VEO-IBD patients [n = 16]. [E] Comparison between the abundance of Caudovirales and Microviridae in VEO-IBD patients with immunosuppressive treatment [n = 24] and without immunosuppressive treatment [n = 30]. The Wilcoxon rank-sum test was used throughout to test for differences.

