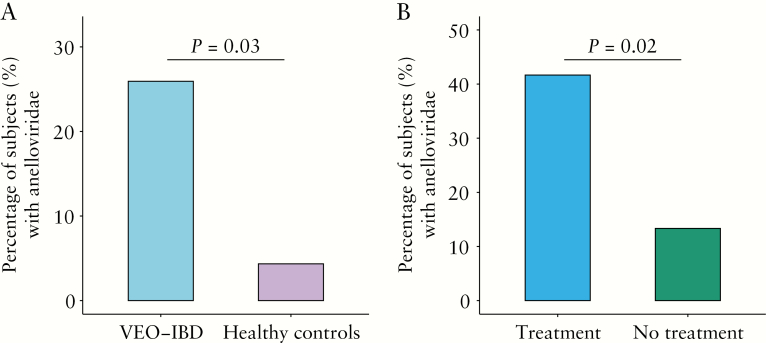
Figure 4.
Anelloviridae prevalence. [A] Comparison between the prevalence of Anelloviridae in VEO-IBD patients [n = 54] and healthy controls [n = 23]. The y-axis indicates the percentage of positive subjects with Anelloviridae. Positive calls required that at least one Anelloviridae genome was more than 33% covered by sequence reads. Samples were compared using Fisher’s exact test. [B] Comparison between the prevalence of Anelloviridae in VEO-IBD patients with immunosuppressive treatment [n = 24] and VEO-IBD patients without immunosuppressive treatment [n = 30]. The y-axis is as in A. Samples were compared using Fisher’s exact test.

