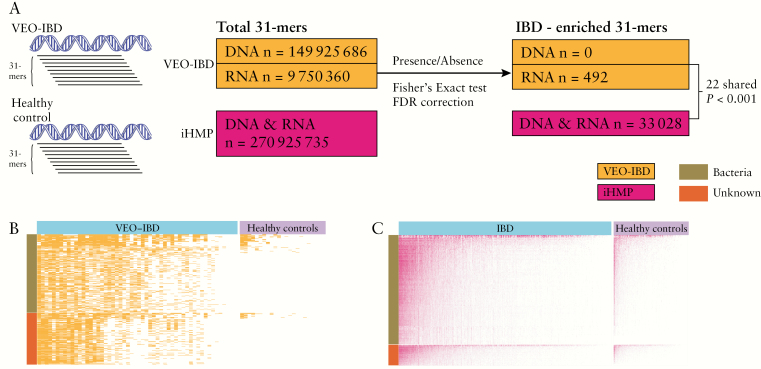
Figure 5.
K-mer-based analysis. [A] Diagram of the analytical approach. [B] Presence/absence heatmap of differentially present RNA 31-mers between VEO-IBD and healthy controls. Red-coloured cells indicate presence while white-coloured cells indicate absence. The y-axis indicates different 31-mers [n = 492], and the y-axis coloir bar represents the nucleotide database annotation of 31-mers. [C] As in B, but showing differentially present 31-mers between IBD and healthy controls from the iHMP dataset.

