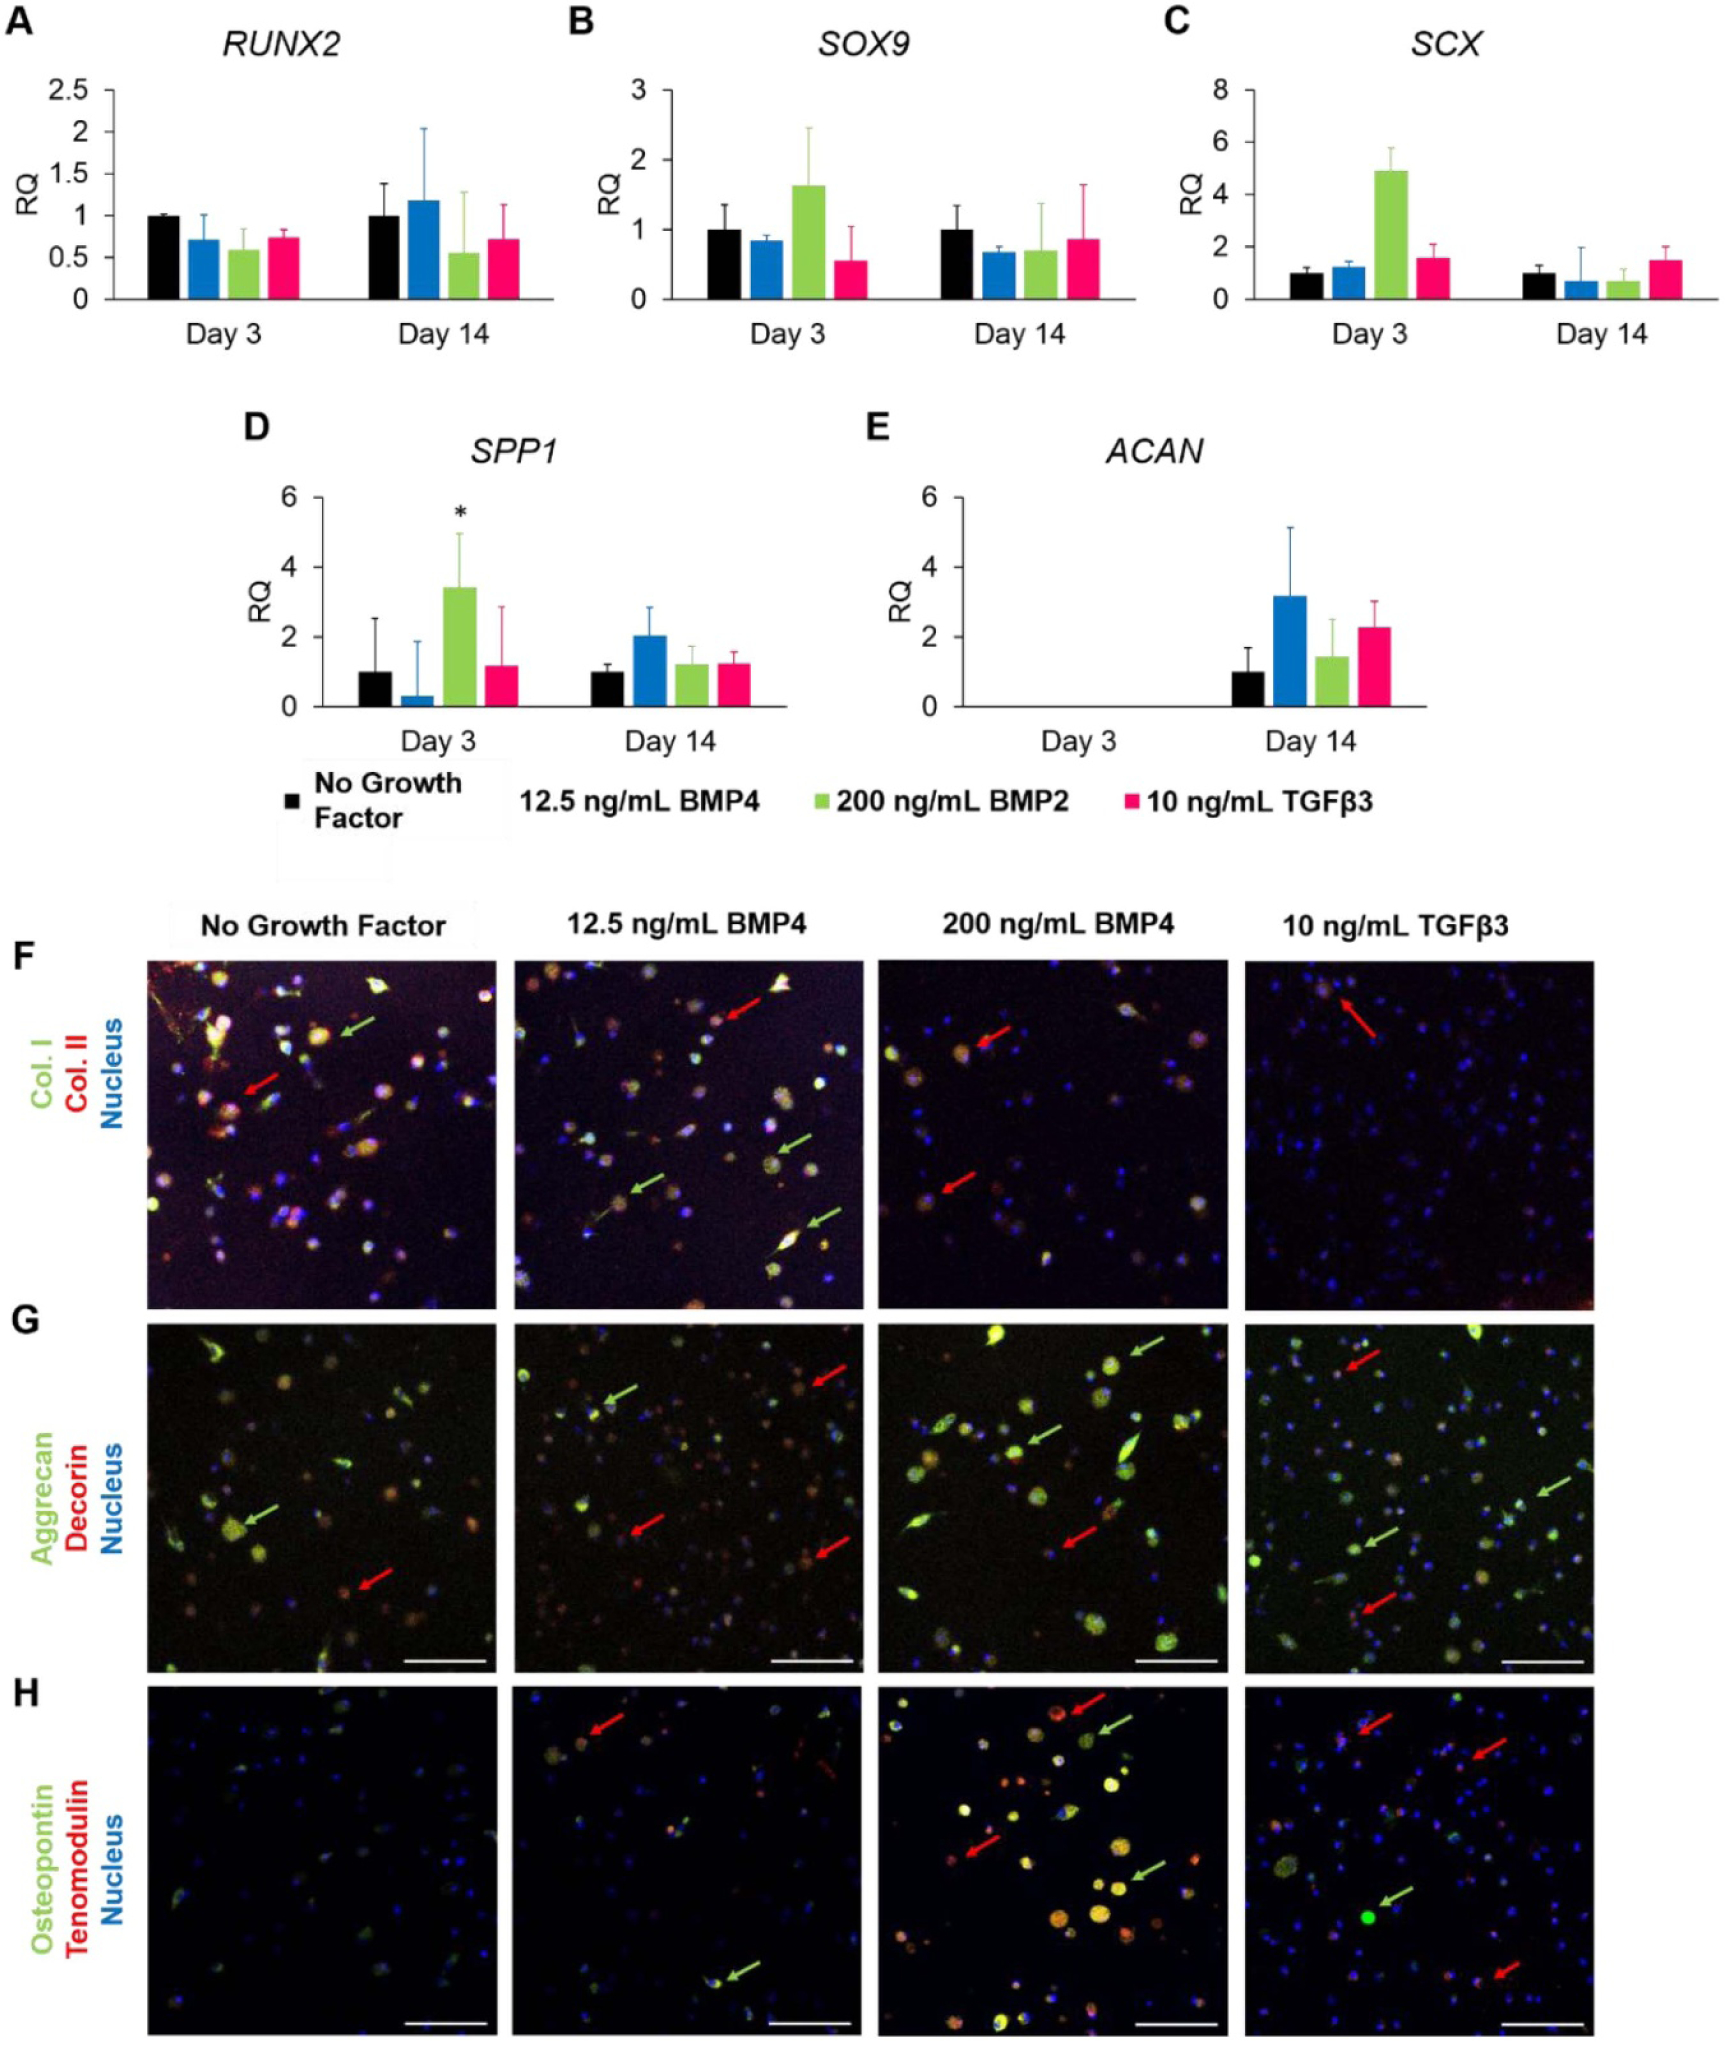
Figure 3.

MSC gene and protein expression in response to 12.5 ng ml−1 BMP4, 200 ng ml−1 BMP4, and 10 ng ml−1 TGFβ3 in 3D culture. (a)–(e) Relative expression of (a) RUNX2, (b) SOX9, (c) Scleraxis, (d) osteopontin, and (e) aggrecan. (f)–(i) Immunofluorescence staining for (f) collagen I (green) and collagen II (red), (g) aggrecan (green) and decorin (red), and (h) osteopontin (green) and tenomodulin (red). Red arrows point to cells of interest stained red, green arrows point to cells of interest stained green. Samples were counter-stained for nucleus (blue). Data are presented as mean ± SD. * indicated p < 0.05. Scale bar = 100 μm.
