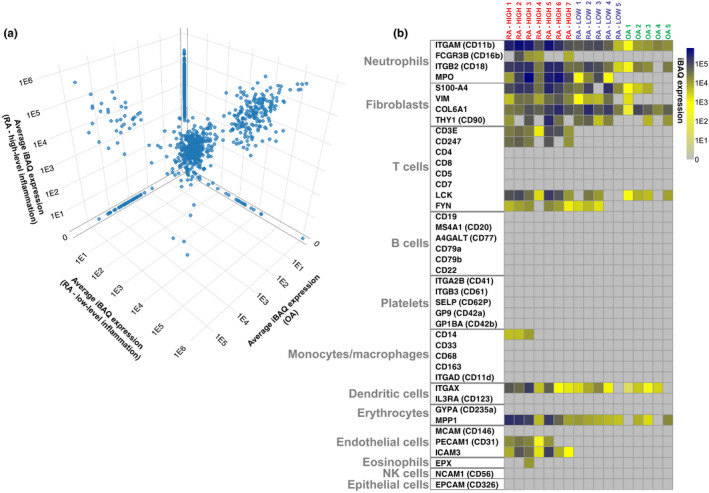
Figure 2.

Expression of cellular lineage markers in proteomics dataset. (a) 3D scatter plot comparing expression of all 1058 identified proteins across disease groups. (b) Expression of specific cellular lineage markers within the proteomics dataset is visualised by heatmap. Heatmap rows show individual lineage markers with originating cell types indicated. Heatmap columns represent individual synovial fluid (SF) extracellular vesicle (EV) samples. Intensity‐based absolute quantification (iBAQ) values are scaled as indicated. Proteins not detected are coloured in grey. UniProt gene names are specified.
