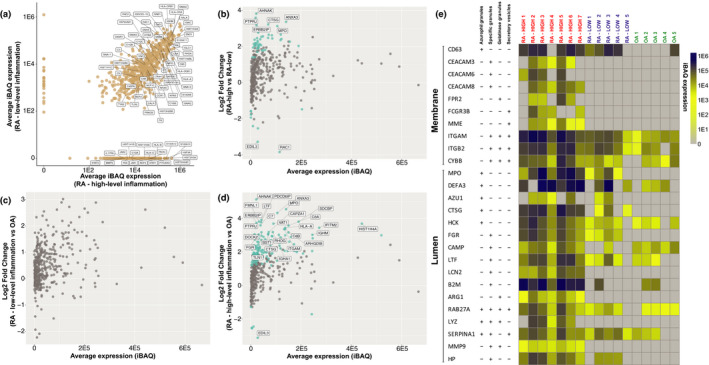
Figure 3.

Pro‐inflammatory proteins are enriched in synovial fluid (SF) extracellular vesicles (EVs). (a) Scatter plot comparing average intensity‐based absolute quantification (iBAQ) protein expression between SF EVs rheumatoid arthritis (RA) patients with high‐ and low‐level inflammation. Selected proteins associated with RA pathology are labelled. (b–d) MA plots of protein abundance vs fold change comparing differences in protein expression between (b) RA (high‐level inflammation) vs RA (low‐level inflammation), (c) RA (low‐level inflammation) vs OA and (d) RA (high‐level inflammation) vs OA. 399 proteins met criteria for inclusion in the differential expression analysis and are represented as dots. Proteins with an adj. P‐value < 0.05 are highlighted in blue. Proteins with an adj. P‐value < 0.05 and a log2 fold change > 3 are labelled. (e) Expression of canonical neutrophil granule proteins detected in SF EVs as illustrated by heatmap. Heatmap columns represent individual SF EV samples and rows refer to corresponding granule proteins. Membrane or luminal location of granule proteins is indicated as well as the granule subset in which they are located. iBAQ values are scaled as indicated. UniProt gene names are specified. The table of granule proteins and respective locations is adapted from Cowland et al. 51 .
