
Fig. 1 |. Development of red fluorescent DA sensors and second-generation green fluorescent DA sensors.
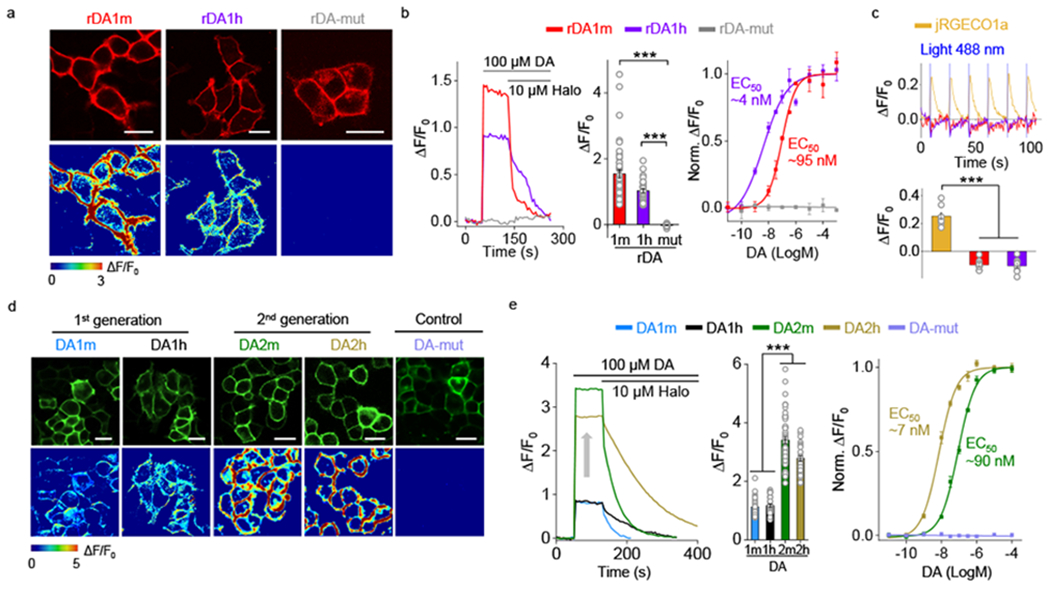
a, Representative images of sensor expression (top) and response to 100 μM DA (bottom) in HEK293T cells expressing the indicated sensor variants. Similar results were observed for more than 10 cells. Scale bars, 20 μm.
b, Representative traces (left), group summary of peak ΔF/F0 in response 100 μM DA (center), and normalized dose-response curves (right) in response to DA. Center, n=46, 32, 17 cells for rDA1m, rDA1h, rDA-mut. Right, n=3 wells with 200–400 cells/well. Two-tailed Student’s t-test was performed. p=3.52×10⁻¹⁰ (***) between rDA1m and rDA-mut; p=4.79×10⁻¹⁸ (***) between rDA1h and rDA-mut.
c, Representative traces (top) and group summary of ΔF/F0 in response to blue light in cells expressing jRGECO1a, rDA1m, or rDA1h. Bottom, n=8, 9, 8 cells for jRGECO1a, rDA1m, rDA1h. Two-tailed Student’s t-test was performed. p=1.23×10⁻⁹ (***) between jRGECO1a and rDA1m; p=1.56×10⁻⁸ (***) between jRGECO1a and rDA1h.
d, Representative images of sensor expression (top) and response to 100 μM DA (bottom) in HEK293T cells expressing the indicated sensor variants. Similar results were observed for more than 20 cells. Scale bars, 20 μm.
e, Representative traces (left), group summary of peak ΔF/F0 in response 100 μM DA (center), and normalized dose-response curves in response to DA (right). Center, n=66, 36, 52, 33 cells for DA1m, DA1h, DA2m, DA2h. Right, n=3 wells with 200–500 cells/well. Two-tailed Student’s t-test was performed. p=2.15×10−41 (***) between DA1m and DA2m; p=8.34×10−39 (***) between DA1m and DA2h; p=9.90×10⁻²⁶ (***) between DA1h and DA2m; p=4.66×10⁻²⁴ (***) between DA1h and DA2h.
Data are presented as the mean ± s.e.m. in b (center and right), c (bottom), e (center and right).