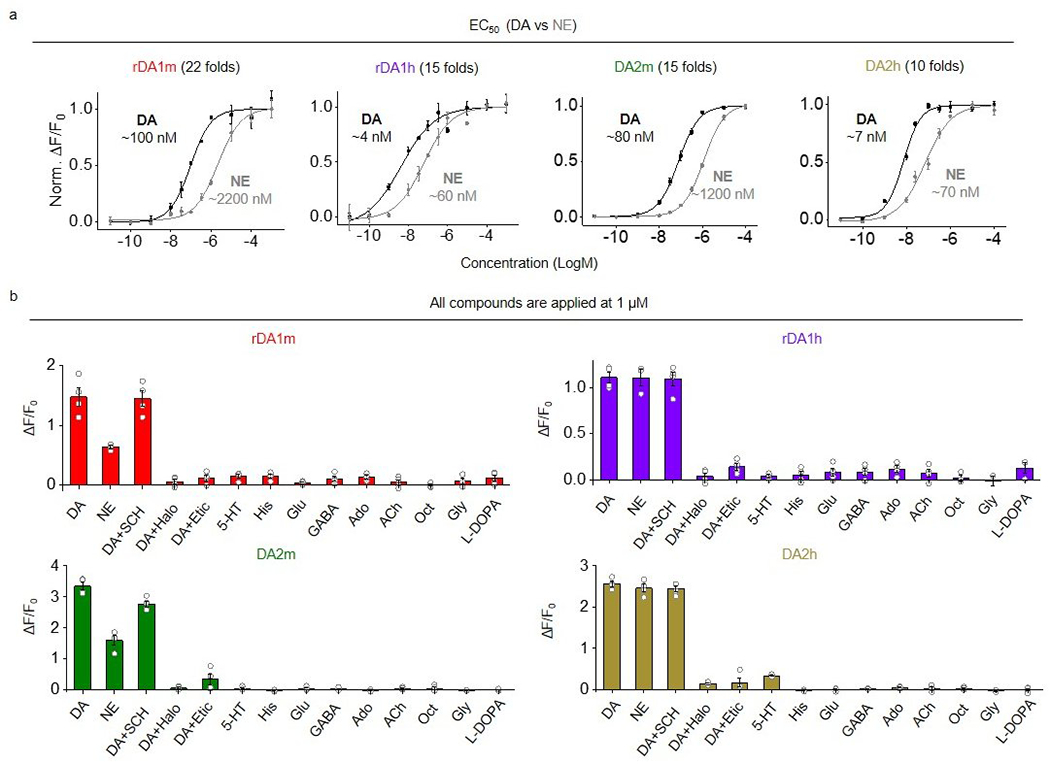
Extended Data Fig. 4. The response of GRABDA sensors to different compounds.

a, The normalized dose-response curves for DA and NE in sensor-expressing HEK293T cells. n=3 wells with 200–800 cells/well.
b, The ΔF/F0 in sensor-expressing cells in response to the indicated compounds applied at 1 μM. n=3 wells for rDA1h in response to NE, 5-HT, Oct, Gly and L-DOPA. n=4 wells for the others. Each well contains 200-1200 cells.
Data are presented as the mean ± s.e.m..
Data replotted from Fig. 2a.
